
Tokenomics
What every model call used and cost, from your own price table. The usage record, the one cost formula, cost basis, the metrics and their closed label set, and who can see usage.
Tokenomics records the tokens and the cost of each model call that goes through DefenseClaw. It is off by default. Nothing is recorded, stored or exported until you turn it on.
Cost comes from a price table that you write in config.yaml. DefenseClaw ships no prices and the gateway prices a call only from that table. A model that is not in the table has no cost. It does not have a cost of zero.
See it run
Turn it on
Set observability.tokenomics.enabled and add a price table. The numbers below are examples. Use the prices of your own contract.
observability:
  tokenomics:
    enabled: true
  pricing:
    version: "2026-11-12.1"
    models:
      - provider: anthropic
        model: claude-example-*
        input_per_mtok: 1.00
        output_per_mtok: 5.00
        cache_read_per_mtok: 0.10
        cache_write_per_mtok: 1.25
The gateway applies the change without a restart. Change version whenever you change a price, because every usage record carries it. Every key, default and limit is in Tokenomics and pricing.
You can do the same from the command line. This turns tokenomics and the local store on and writes the reviewed default price table only if config.yaml has none. It never replaces a table you wrote.
defenseclaw setup tokenomics --enable
defenseclaw setup tokenomics --status --json
defenseclaw setup tokenomics --disable   # tokenomics and the local store off
--disable turns tokenomics and the local store off. When the gateway applies the change, it writes the usage it still buffers, closes the store and writes it no more. The price table stays in config.yaml, and the usage already recorded stays in model_usage in the data directory until you delete that folder.
Check the seeded prices against your contract before you rely on the cost. A model with no row has no cost.
On a managed host both blocks come from the admin config.yaml in the signed bundle. A user cannot set them.
A bundle that sets observability.tokenomics or observability.pricing needs --min-product-version 1.0.10 when it is signed, and signing refuses it with config_invalid otherwise. The key counts whatever its value, so tokenomics: {enabled: false} needs 1.0.10 too. A device on 1.0.9 or earlier refuses the whole admin config.yaml for either block, because its schema is closed. A device group that stays on an older build gets a config.yaml without both blocks.
What you see
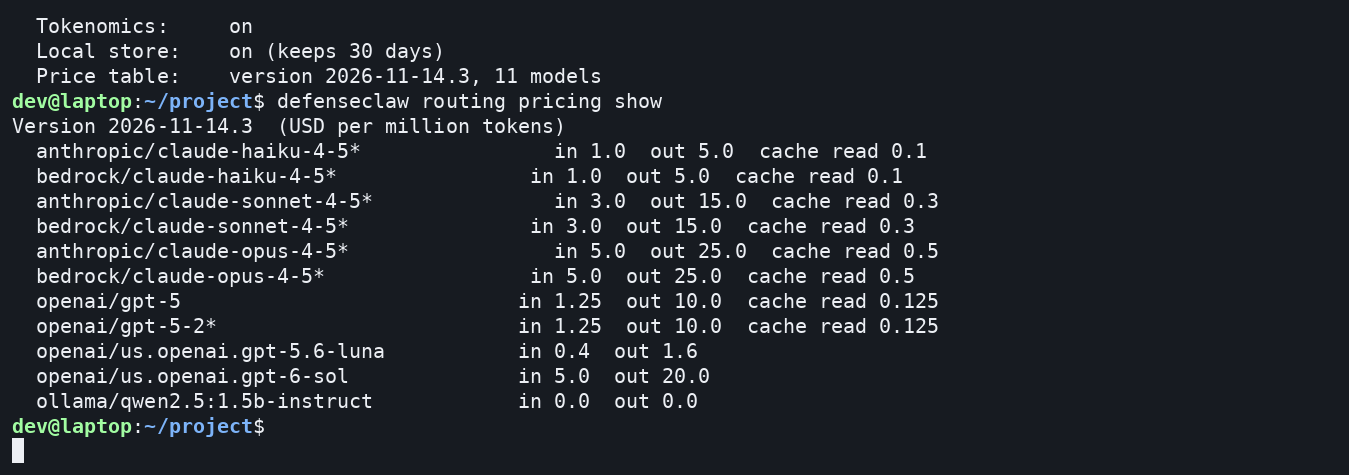
The setup tokenomics status command shows whether usage is recorded and which price table is in force. The routing pricing show command lists the prices, in USD per million tokens. The prices in the screenshot are examples.
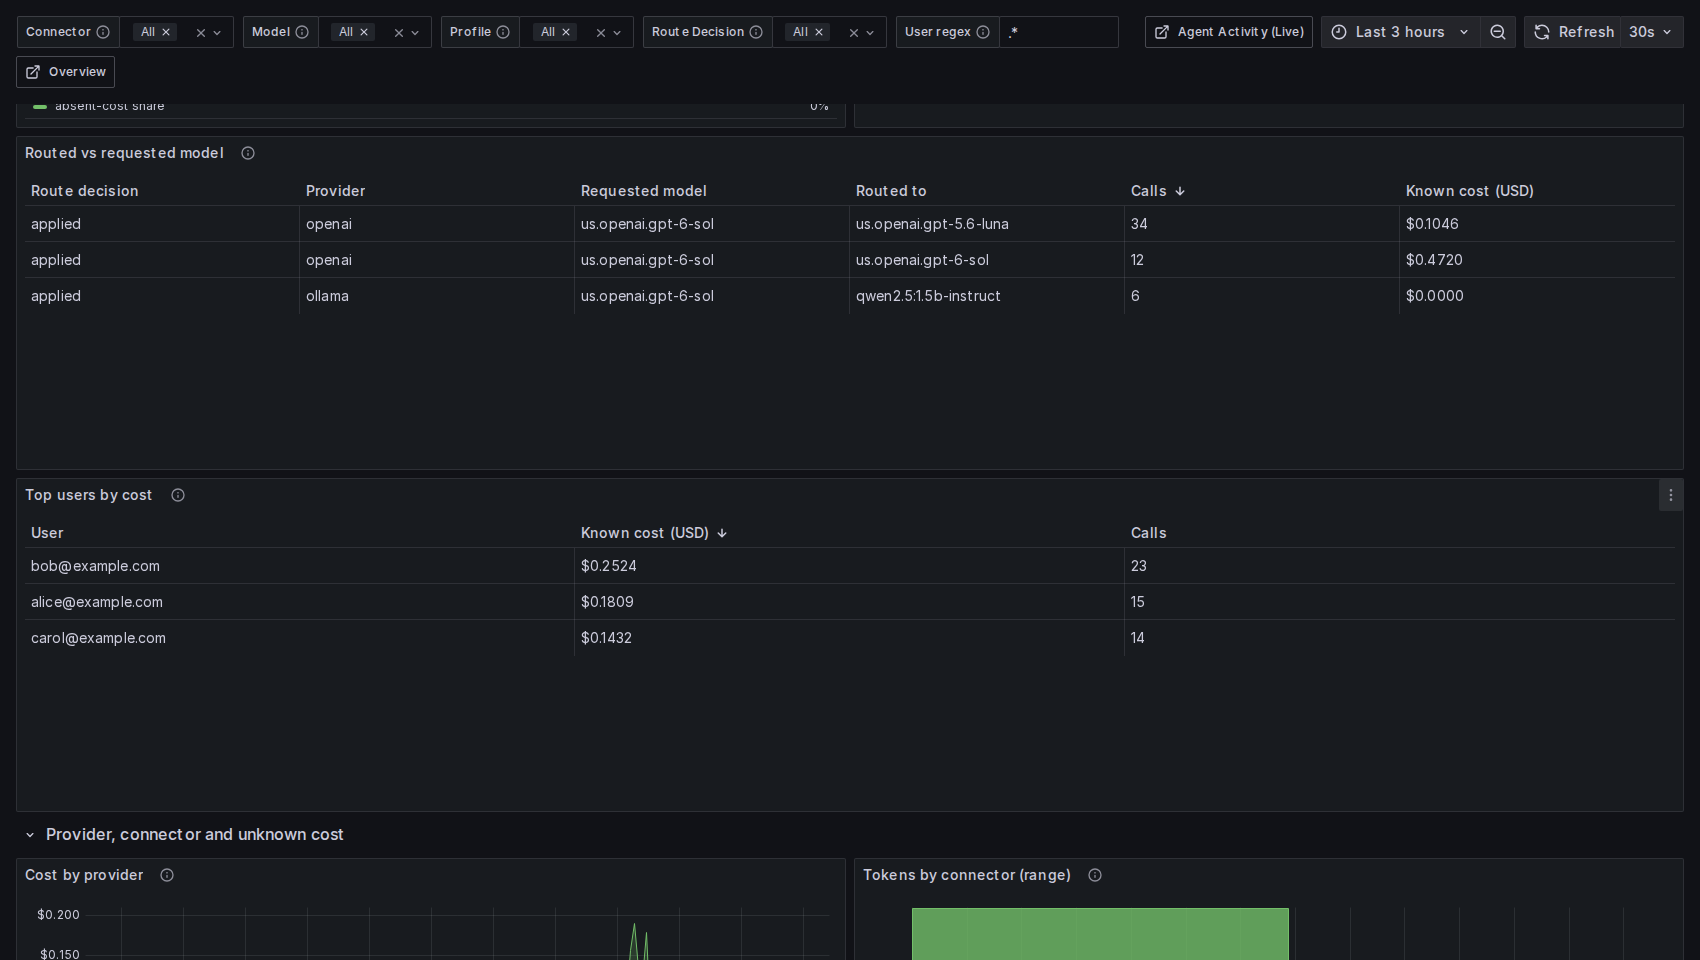
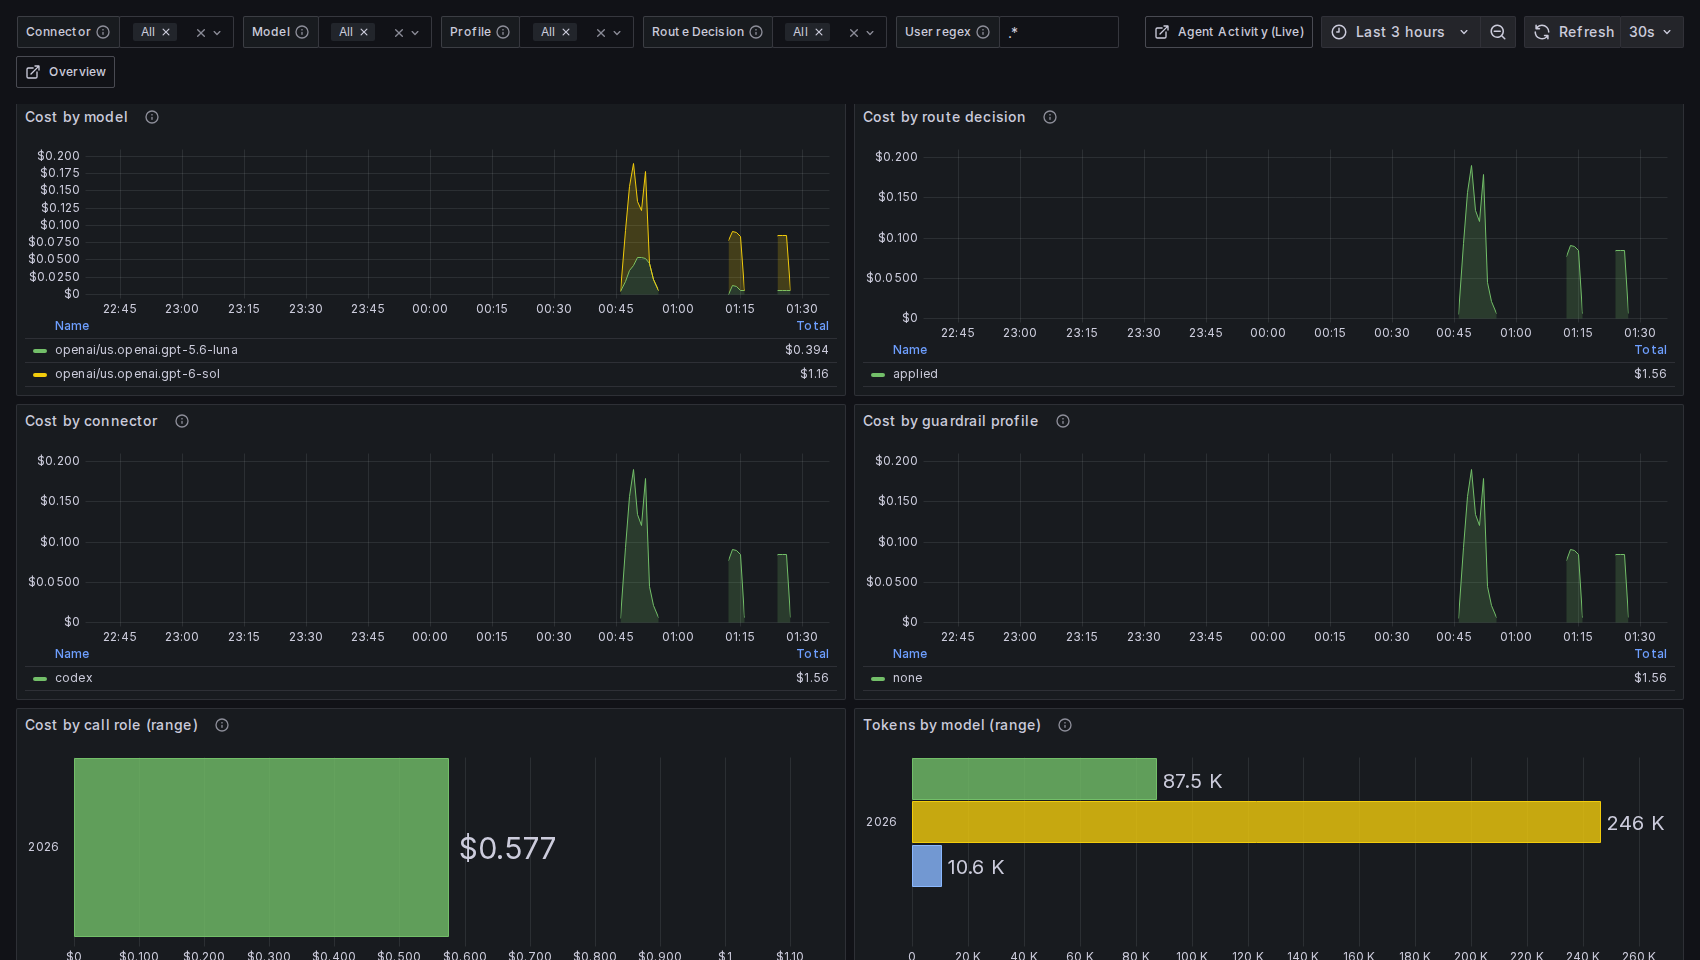
The Tokenomics board in Grafana shows the same calls: the model the agent asked for against the model that answered, with the known cost of each route, and the cost of each user.
What a usage record holds
Each finished model call writes one log.model.usage record in the model.io bucket, with the action model_usage. Audit sinks migrated from v7 do not receive it. It holds:
| Part | Fields |
|---|---|
| Tokens | input, output, cache read, cache creation and reasoning counts, each only when the provider reported it, and the response model. defenseclaw.usage.source says where the counts came from: the response body, the end of a stream, the response headers (Bedrock), or the agent OTLP stream |
| Routing | the model the client asked for, the model and provider that served the call, the route decision, category, rule ID and source, and the guardrail profile |
| Actor | the connector, the call role, the API family and the verified identity of the caller |
| Timing | upstream time, time to first token and total time |
| Cost | defenseclaw.cost.usd, its basis, the price entry that priced the call, the table version and the table digest |
A record never holds a prompt or a response. If the response had no usage block, the record has no token counts. DefenseClaw does not estimate tokens.
The call role is one of agent, judge, decision_model, ai_defense and router_classifier. observability.tokenomics.roles limits which roles are recorded.
The record follows the redaction profile of the model.io bucket like any other record. See Redaction.
How tokens are counted
Every provider API reports tokens a little differently, so DefenseClaw turns each response into one shape:
- Input is every prompt token billed, cached ones included. Cache read and cache creation are parts of it.
- Output is every completion token billed, reasoning ones included. Reasoning is a part of it.
A count the response does not carry stays absent. It is never filled in with 0.
How cost is computed
There is one formula. Cache and reasoning tokens are priced at their own rate when the entry has one, and at the input or output rate when it does not.
uncached = input - cache_read - cache_creation
usd = (uncached*in + cache_read*(cr or in) + cache_creation*(cw or in)
+ (output-reasoning)*out + reasoning*(rs or out)) / 1e6in, out, cr, cw and rs are the input_per_mtok, output_per_mtok, cache_read_per_mtok, cache_write_per_mtok and reasoning_per_mtok rates of the matching table entry, in USD per million tokens.
Cost has no value when:
- the response had no input or output count,
- no entry matches and
observability.pricing.unknown_modelisomit(the default), or - the counts do not add up, for example more cache tokens than input tokens.
With unknown_model: fallback a model without an entry is priced with observability.pricing.fallback, and the record names the price entry fallback.
Cost basis
defenseclaw.cost.basis says where the cost came from.
| Basis | Meaning |
|---|---|
computed | Tokens priced from your table. |
reported | A cost the provider or the agent reported for that one call. It wins over a computed cost when cost.keep_reported is true, and the computed value stays on the record as defenseclaw.cost.computed_usd for comparison. |
none | No cost is known. The record has no defenseclaw.cost.usd. |
Only a per-call reported cost is used. A running total for a session is never copied into a usage record.
Absent cost is never 0
A call with no known cost adds nothing to defenseclaw.model.cost. It does not add 0. A dashboard that sums the metric therefore shows the cost of the calls that could be priced, and the calls with basis none are the ones to look at when the number looks low.
Calls the table cannot fully price
The table is flat. Some billing features change the price in ways it cannot show. When a response shows one, the record still gets the computed cost, and defenseclaw.usage.partial names the feature so you know the cost may be lower than the bill:
| Reason | Cause |
|---|---|
service_tier:<tier> | An Anthropic priority or batch tier, or an OpenAI flex, priority or scale tier. |
cache_ttl_1h | Anthropic cache writes with a one hour lifetime. |
server_tools | Anthropic web search or web fetch server tools. |
long_context | A Gemini Pro prompt of more than 200,000 tokens. |
speed:fast | Claude Code fast mode, in the agent OTLP import only. The reported cost of the call already includes it. |
Metrics
Counters carry the numbers to Prometheus, Grafana or any other metric destination.
| Metric | Unit | Meaning |
|---|---|---|
defenseclaw.model.cost | USD | Cost of model calls that have a cost. |
defenseclaw.model.tokens | tokens | Token counts, with a kind label. |
defenseclaw.tokenomics.dropped | records | Usage records lost before they were counted: the bounded queue was full, or the local store reached its bucket or row cap. |
defenseclaw.model.cost.baseline | USD | What the same calls would have cost on the model the client asked for. |
defenseclaw.model.cost.compared | USD | What those same calls really cost. |
Saving against the requested model
defenseclaw.model.cost.baseline is the counterfactual of routing: the call's own tokens priced on the model the client asked for, from the same price table and the same formula. defenseclaw.model.cost.compared is the actual cost of the same calls. A call is counted on both sides only when its own cost is known and the requested model has a price (a side that is free adds nothing to its counter); every other call is counted on neither, so the difference of the two counters is the saving of exactly the calls that can be compared. The log record carries the same number as defenseclaw.cost.baseline_usd and is absent when there is no baseline. When an agent reports its own cost for a call, that reported cost is the cost side and the baseline still comes from your price table, so the two sides can differ by the provider's own pricing. Only agent calls have a baseline. Judge, decision model, AI Defense and router classifier calls have none. Both counters use the labels of defenseclaw.model.cost.
The Routing, Savings & Budgets board shows both counters and the saving.
Routing and budget metrics
| Metric | Unit | Meaning |
|---|---|---|
defenseclaw.semantic_routing.decision | decisions | One count per routing decision, from the guardrail proxy and the route-only listener. Labels: result (applied, fallback, denied), error.code, decision, connector, route_source, route_category, filtered_by, listener, deny_reason and budget_id. |
defenseclaw.budget.limit | USD | The limit of one routing budget. |
defenseclaw.budget.spend | USD | What all subjects of the budget spent in the current window. Absent while the spend is loading, and absent for a group or connector budget under a fleet budget store (the store answers a pooled budget with over the limit only, so a device cannot know its total). |
defenseclaw.budget.peak_subject_spend | USD | What the highest single subject spent in the window. Absent in the same cases as defenseclaw.budget.spend. |
defenseclaw.budget.subjects_exceeded | subjects | Subjects at or over the limit. |
defenseclaw.budget.store.healthy, defenseclaw.budget.store.sync_age | state, seconds | The fleet budget store sync, reported only when routing.admin.budget_store is set. sync_age counts from the last time the fleet store itself answered, so it keeps growing while the device falls back to its own spend; it is absent until the first answer. |
The gauges keep their last value until the next report: after a budget is removed, or when its spend becomes unknown, a destination that keeps cumulative gauges can show the last value until the gateway restarts. The budget gauges carry only budget_id (the id you chose), scope and period. A user, a directory group and a budget subject are never labels. route_source, filtered_by, listener and deny_reason are closed sets, and route_category and budget_id are bounded: a value that is not a short identifier is reported as other, and a gateway keeps at most 32 distinct categories before it reports further ones as other, whatever a classifier answers. deny_reason is one of budget_exceeded, budget_unavailable, budget_cost_unknown, budget_downgrade_unavailable, rule_deny, identity_unconfirmed, routing_admin_denied, routing_sensitive_local_unavailable or other; filtered_by is sensitive, unknown_alias, policy, api, capability, credential, endpoint or other. No label holds prompt text, a model alias, an endpoint or a refusal message.
defenseclaw.model.tokens counts five disjoint kinds: input (uncached prompt tokens), cache_read, cache_creation, output (without reasoning) and reasoning. No kind contains another, so the sum over all kinds is the real total. The gen_ai.client.token.usage metric is unchanged and counts input with cache and output with reasoning, so it does not add up the same way.
Labels
The cost and token metrics may carry only these labels, set by observability.tokenomics.metrics.labels: connector, provider, model, route_decision, call_role and profile. The list is closed. Any other label is refused when you save the config.
The model label is the price entry that matched, or other. A client chooses its own model string, and the entry key keeps the label set bounded.
Identity is never a label. A metric label creates one time series per value, so a user, group, session or device label would make the series count grow with your people and would put names in every metric store. Per-user numbers come from the usage record and the local store, not from metrics.
Who sees usage
- A user sees their own usage. An administrator sees everyone.
- The record carries the verified identity of the caller, the same identity attributes as other model records. If the caller cannot be verified, the usage is visible to administrators only.
- Group names stay on the endpoint, in the local store and the administrator view. They are never put on an exported record or a metric.
- The local store, when
observability.tokenomics.local_store.enabledis true, keeps an hourly aggregate in<data_dir>/model_usage/model_usage.dbforretention_days. It holds counts, cost and the dimensions above, no prompt or response text.
Reading usage
The gateway answers GET /usage?by=model|connector|route|profile|role|provider|user|group|hour&since=24h|7d from the local store. A per-user install sees its own rows. On a managed host an administrator sees all rows, and any other account sees only the rows of the identity the gateway verified for the request. The per-group rollup is for administrators. On managed Windows a standard account gets its last 24 hours in the own-status answer, because it reaches the gateway only through the own-status pipe.
Agents that report their own usage
Claude Code and Codex send their own usage over OTLP. observability.tokenomics.native_otel_import lets DefenseClaw read it. DefenseClaw pairs the agent figures with the route-only listener record of the same call, by the provider request id or else by the token counts. When both records arrive within 15 minutes, the call is counted once, from the listener record. A call the listener did not record, for example from an agent session started before defenseclaw routing enable, is counted from the agent figures.
A call can still be counted twice when:
- the agent exports it more than 15 minutes after the call,
- the gateway restarts between the call and the export,
- the two records report different token counts and only one of them has a request id.
Sandbox only
This import only has a source inside an isolated OpenShell sandbox. DefenseClaw renders the OTLP exporter and its scoped token into the agent's settings there and nowhere else. On a host install, setup does not enable Claude Code or Codex telemetry (it removes only exporters it wrote itself), so the switches below change nothing and no claude_code.api_request or codex.sse_event record is imported. On a host, usage and cost come from the calls the guardrail proxy carries (route-only routing included). To see a cost the agent reports next to ours on a host, send the agent's own OTLP to a collector you run.
| Agent | Event read | What the usage record gets |
|---|---|---|
| Claude Code | claude_code.api_request log, one per API call | Input (input_tokens plus both cache counts), output, cache read and cache creation tokens, the model, the duration, and cost_usd as a reported cost for that call. The table cost stays next to it for comparison. |
| Codex | codex.sse_event log with event.kind response.completed | Input, cached input, output and reasoning tokens and the model. Codex reports no cost, so the cost comes from the price table or is absent. |
A count the agent did not send stays absent. Running totals are never read as the cost of a call: DefenseClaw does not import the Claude Code claude_code.cost.usage counter, and a session total a hook reports stays on the defenseclaw.agent.reported_cost gauge. The records join the hook session of the same conversation, like the other records the agent sends.
Grafana dashboard catalog
A complete map of the DefenseClaw Grafana dashboards, which telemetry backend each board uses, how drill-downs connect, and how to interpret empty panels.
Agent360 dashboard
Drill from any observed agent into lifecycle, executions, model and tool activity, tokens, cost, security decisions, hook enforcement/recovery paths, traces, and agent topology.