Agent360 dashboard
Drill from any observed agent into lifecycle, executions, model and tool activity, tokens, cost, security decisions, hook enforcement/recovery paths, traces, and agent topology.
Agent360 is the per-agent drill-down in the bundled Grafana stack. It answers three questions from one stable identity: what is this agent doing now, what did it call, and where did time, tokens, cost, or failures accumulate? New root agents and subagents appear automatically as hook events arrive; no dashboard file is generated per agent.
Open an agent
- Start the local observability stack.
- Open Grafana at http://localhost:3000.
- Open DefenseClaw → Agent identity and select an Agent ID in Runtime Agent Directory.
- The link opens DefenseClaw → Agent360 with the connector, stable agent identity, and time range carried into the dashboard.
You can also open Agent360 directly and use its variables:
| Variable | Use |
|---|---|
| Connector | Separate Codex, Claude Code, and other hook connectors. |
| Agent | Select the durable root or delegated agent identity. |
| Scope | This agent isolates one agent; Agent tree includes every correlated descendant. |
| Lifecycle | Restrict the view to one resumed-session lifecycle. |
| Execution | Restrict the view to one concrete attempt within a lifecycle. |
| Trace ID | Pivot the lower section to one Tempo execution trace. |
Read the overview
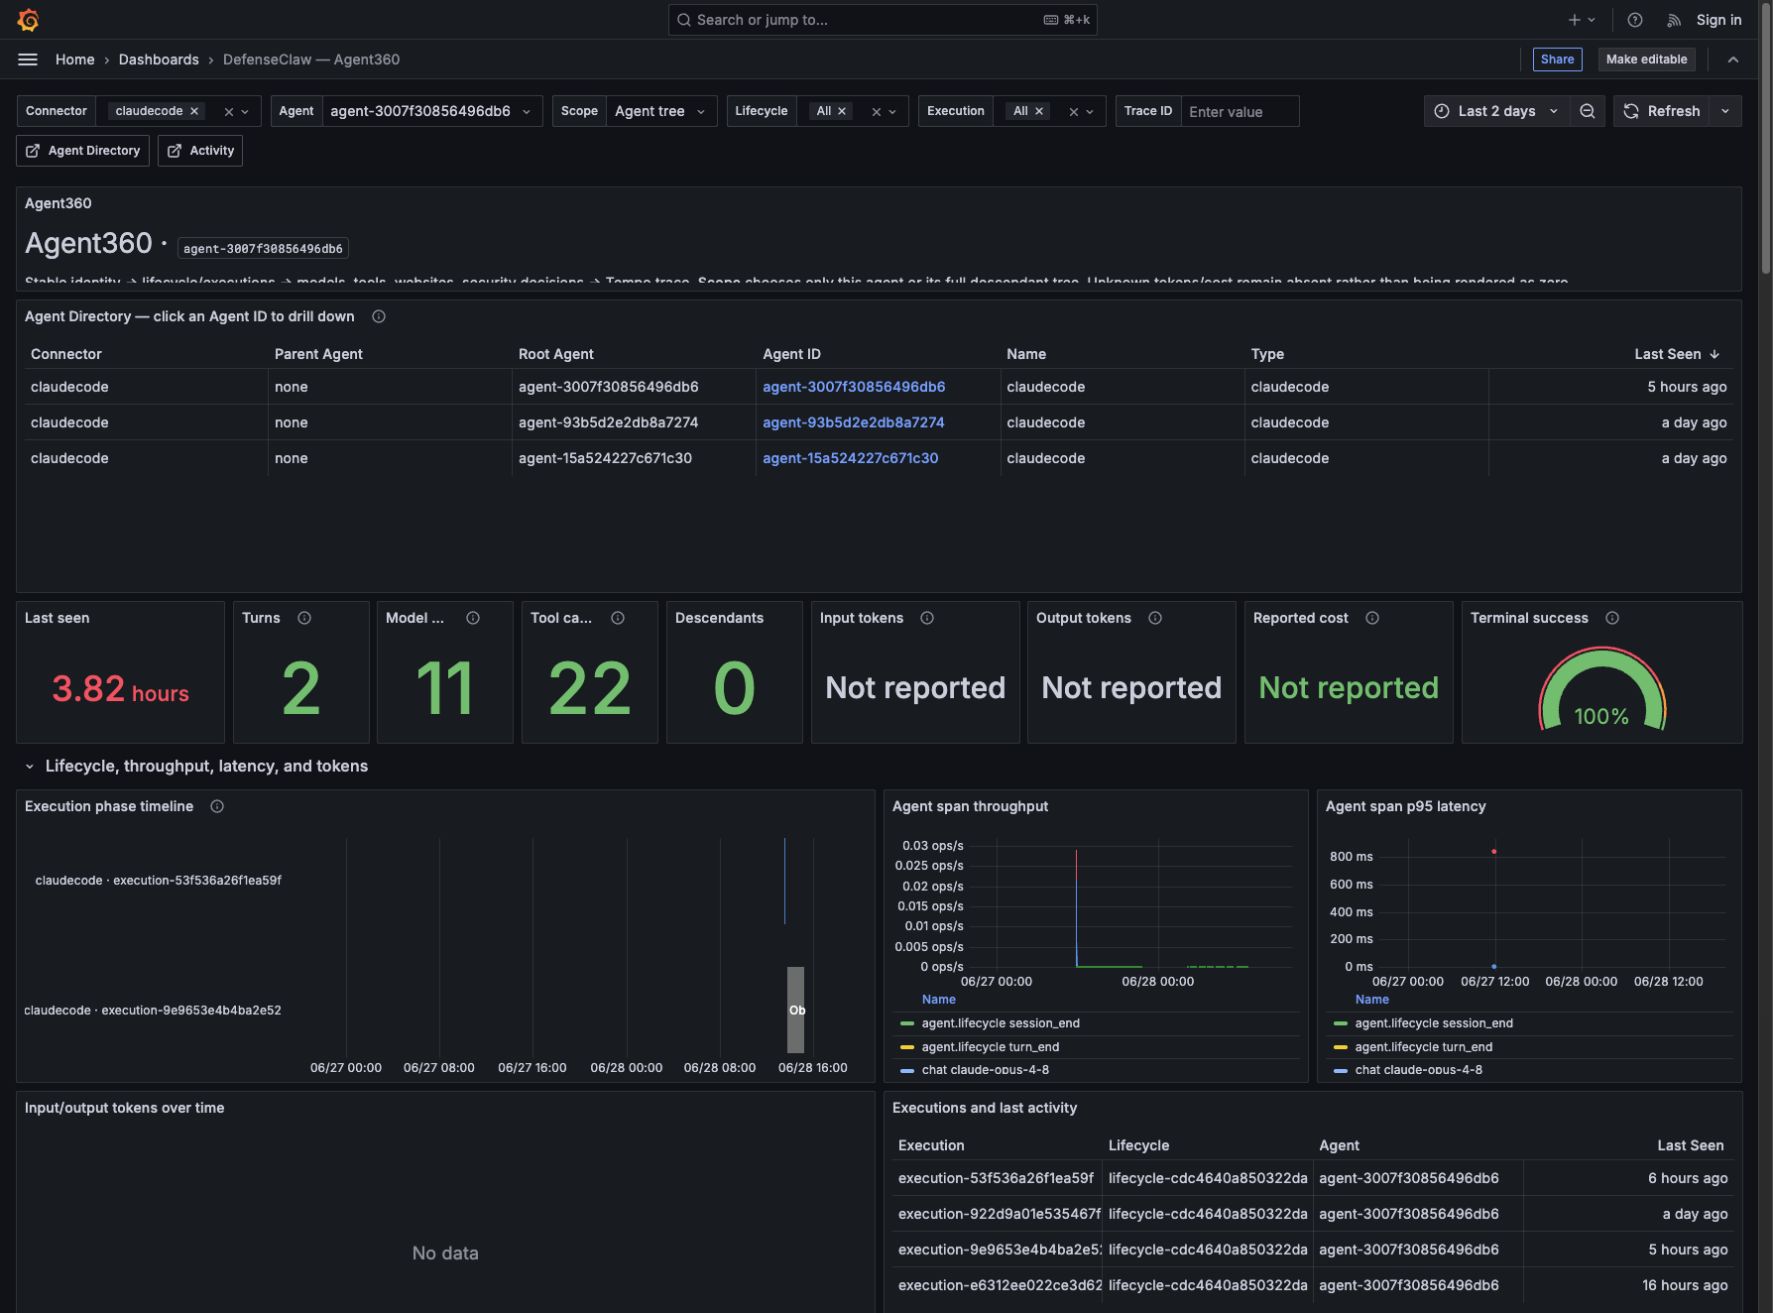
The top of the dashboard is deliberately ordered from identity to health to execution detail:
| Panel | What it means | Why it is useful |
|---|---|---|
| Agent Directory | Agents observed for the selected connector and time range, including root/parent relationships and last-seen time. | Confirms discovery and provides a one-click drill-down to another agent. |
| Last seen | Age of the newest correlated signal. | Finds silent, disconnected, or unexpectedly idle agents. |
| Turns | De-duplicated completed conversational turns. | Compares useful interaction volume without counting every hook delivery. |
| Model calls | Completed chat/model operations. | Separates model work from lifecycle envelopes and tool calls. |
| Tool calls | De-duplicated completed tool operations. | Reveals automation intensity and tool-heavy executions. |
| Descendants | Correlated child agents under the selected root. | Detects delegation and unexpected fan-out. |
| Input/output tokens | Connector- or provider-reported usage only. | Tracks context growth and response volume without inventing estimates. |
| Reported cost | Cost reported by the connector, normalized for cumulative and per-call semantics. | Supports cost investigation while preserving the source's meaning. |
| Terminal success | Successful terminal events divided by all terminal outcomes. | Measures completed versus failed/interrupted lifecycles; notification-only events do not inflate it. |
| Enforced hook blocks | Final hook decisions returned to a connector as block. | Separates a real prevented action from a scanner-only or observe-mode result. |
| Observe-mode would-blocks | Guardrail blocks that were returned as advisory/allow because enforcement was unavailable or disabled. | Shows where a policy would stop work before switching a connector to action mode. |
The Execution phase timeline preserves sub-second ordering for lifecycle, model, and tool phases. Throughput and p95 latency show whether activity is increasing and which operation class is slow. Executions and last activity keeps the lifecycle and execution IDs visible so a resumed long-running agent does not look like an unrelated process.
Follow an enforced or alternative path
The Hook enforcement and recovery paths section answers a different question from the verdict list: what did DefenseClaw actually return to the agent, and what did the agent do next?
Each hook delivery emits a durable hook_decision record after connector
capability and enforcement-mode mapping. It carries the same agent, root,
lifecycle, execution, operation, trace, evaluation, and rule identifiers as
the surrounding lifecycle, model, and tool records.
| Field | Meaning |
|---|---|
| Action | The final response sent to the connector. block means the hook was enforced. |
| Raw action | The guardrail result before connector/mode mapping. |
| Enforced | true only when the connector was actually told to stop. |
| Would block | true when a raw block became advisory/allow, such as observe mode or a non-enforceable hook surface. |
| Evaluation / rule IDs | Join keys for the matching verdict and individual scanner findings. |
Start with a spike in Hook action outcomes over time, then read Decision → recovery path from top to bottom. Every row is scoped to the selected lifecycle and execution. The rows immediately after a decision are the observed path: a new tool call indicates an alternative tool attempt, a new prompt/model response indicates the agent reconsidered, another decision shows a retry, and a terminal lifecycle event shows that the session ended.
An enforced block does not guarantee that an agent retries; when no later row appears, DefenseClaw did not observe another hook event in that execution. It does not infer a retry from a missing signal.
Follow models, tools, destinations, and cost
The analytics row breaks the selected agent or tree down by:
- model calls and execution-lifetime p95 latency by provider/model;
- top tools, tool p95 latency, and website/network destinations;
- reported input/output tokens and reported cost by model and over time;
- lifecycle funnel, span error rate, latency heatmap, and active agents.
Use these panels together. A high tool count with a normal tool p95 usually means expected automation; a low call count with a high p95 points to a single blocking tool. A rising model-call count without turns completing points to a retry loop or an agent that is still active.
Inspect the dependency graph
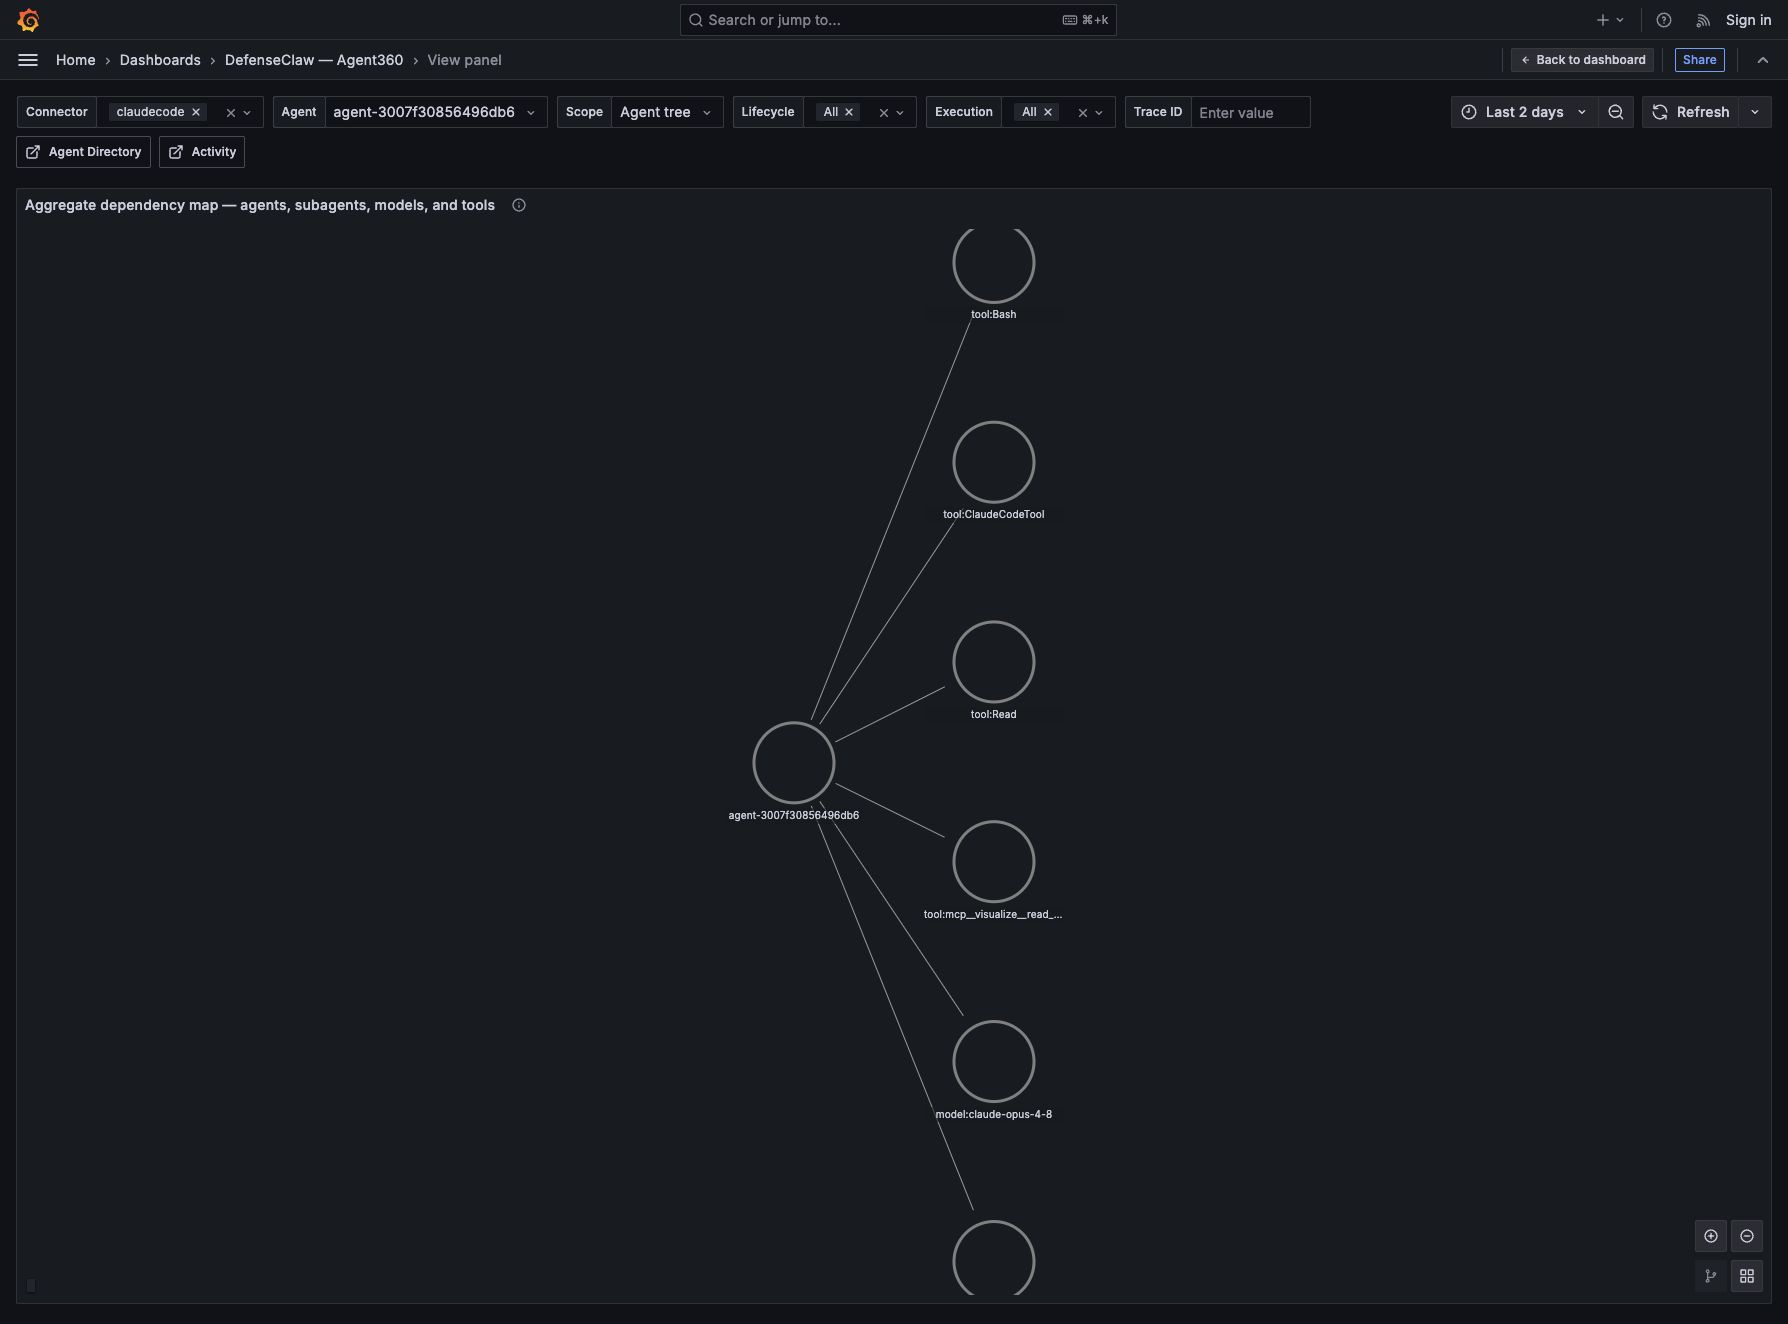
The aggregate dependency map uses directed edges from agents to their observed dependencies:
agent:*nodes are stable root or delegated agent identities;model:*nodes come fromgen_ai.provider.nameandgen_ai.request.model;tool:*nodes come fromgen_ai.tool.name;- agent-to-agent edges use the stable root/parent relationship.
The map is aggregated across the dashboard time range, so it answers what does this agent depend on? The per-trace Tempo graph answers a different question: what happened, in what order, for this one request? Use the aggregate map to find unexpected dependencies, then choose a trace to inspect the exact execution path.
Drill into logs and traces
The lower dashboard correlates all three local backends:
| Backend | Agent360 uses it for |
|---|---|
| Prometheus | Directory, counts, state, throughput, latency, token/cost totals, and aggregate topology. |
| Loki | Lifecycle, model, tool, network, error, verdict, judge, finding, final hook decision, and approval-stage event details. |
| Tempo | Completed-operation and enforcement-attempt trace list, waterfall, ordered execution sequence, phase durations, directed phase edges, and per-trace node graph. |
Select a Trace ID in Operation and enforcement traces. The data link preserves the selected connector, agent, scope, lifecycle, execution, and time range while replacing only the trace ID; it does not carry an empty trace variable. The selected-trace waterfall then shows the hook attempt alongside its child operation spans. If the trace is outside the current dashboard time range, widen the time picker before selecting it.
Interpret missing values correctly
Agent360 does not fabricate telemetry:
| Display | Meaning |
|---|---|
| 0 | The signal is supported and no matching event was observed in the selected scope and time range. |
| No data | No matching series/log/trace exists for that panel, often because the selected operation never occurred. |
| Not reported | The connector did not provide that optional value, such as tokens or cost. |
For example, Claude Code can expose completed model operations without reporting token or price fields for that hook. Agent360 shows model calls while leaving tokens and cost as Not reported. This is more accurate than estimating usage from message length. Older data collected before a schema or dashboard upgrade is not backfilled; generate a new turn after upgrading to validate newly supported fields.
Common investigation paths
| Question | Start here | Then drill into |
|---|---|---|
| Why is an agent still running? | Last seen + execution phase timeline | Lifecycle logs and the newest Tempo trace. |
| Which tool made the execution slow? | Top tools + tool p95 | Selected trace waterfall and ordered sequence. |
| Did a subagent cause the failure? | Agent tree + dependency map | Child agent ID, errors/decisions, then its trace. |
| Why did tokens or cost spike? | Tokens/cost over time | Provider/model breakdown and LLM turn details. |
| Was the action blocked, advisory, or approved—and what happened next? | Hook enforcement and recovery paths | Decision → recovery path, verdict/finding details, then the matching Tempo trace. |
| Why is a panel empty? | Scope and time-range variables | Use the table above, then confirm the connector reported the field. |
Prompts and outputs are persistent telemetry
Agent360's Loki and Tempo panels follow DefenseClaw's persistent-sink redaction policy. Keep redaction enabled in shared or multi-tenant deployments. Only operators who have explicitly disabled redaction should expect raw prompt, completion, tool argument, or tool result bodies in these panels.
Grafana dashboard catalog
A complete map of the DefenseClaw Grafana dashboards, who each board is for, which telemetry rail it uses, how drill-downs connect, and how to interpret empty panels.
Galileo
Send DefenseClaw GenAI traces to Galileo Cloud or self-hosted Galileo while keeping local observability enabled.