Local observability stack
One-command OpenTelemetry + Loki + Tempo + Prometheus + Grafana stack, pre-wired to the DefenseClaw gateway. Grafana on :3000, dashboards seeded, no manual config.
defenseclaw setup local-observability brings up a full local OpenTelemetry stack and wires the gateway to it in one shot. It's what the project itself uses for development, demos, and rule-pack tuning.
What it brings up
The stack runs from bundles/local_observability_stack/docker-compose.yml:
| Service | Image / role | Default port |
|---|---|---|
otel-collector | OpenTelemetry Collector — fans out to Prom/Loki/Tempo | 4317 (gRPC), 4318 (HTTP) |
prometheus | Metrics store | 9090 |
loki | Log store (gateway audit + sink failures) | 3100 |
tempo | Trace store (per-decision spans) | 3200 |
grafana | UI with seeded DefenseClaw dashboards | 3000 |
All five run under one Compose project (defenseclaw-local-observability). They share a Docker network and the bundled Grafana datasources point at each container by service name.
Bring it up
Start the stack.
defenseclaw setup local-observability upThe openclaw-observability-bridge binary (shipped in bundles/local_observability_stack/bin/) drives Compose, waits for healthchecks, and writes the OTLP endpoint into ~/.defenseclaw/config.yaml under otel:.
Open Grafana. http://localhost:3000 — anonymous viewer access is enabled by default for the demo dashboards. Sign in as admin/admin to edit.
Generate traffic. Run any DefenseClaw-managed agent, or send a synthetic event to every configured sink:
defenseclaw setup observability test local-observabilityThe test subcommand sends a probe to the named local-observability
destination. Run defenseclaw setup observability list first if you renamed
it. Test other destinations individually by name; notifier webhooks use
defenseclaw setup webhook test <name> instead.
Watch the dashboards populate. "DefenseClaw → Overview" lights up first; per-rail dashboards (Guardrail, Admission, Judge, HITL) follow as the events flow.
up also refreshes the host-mounted stack copy in ~/.defenseclaw/observability-stack/ from the bundled version before Compose starts. That includes Grafana dashboards, Prometheus rules, Loki, Tempo, and OTel Collector config. Deleting Docker containers is not enough to update those files because they live on the host; pass --no-refresh-config only when you intentionally want to keep local edits.
Useful flags
The up subcommand exposes the bridge configuration directly:
defenseclaw setup local-observability up \
  --endpoint 127.0.0.1:4317 \
  --signals traces,metrics,logs \
  --service-name defenseclaw-gateway \
  --with-audit-sink \
--timeout 90| Flag | What it does |
|---|---|
--endpoint | OTLP endpoint the gateway writes into config.yaml. Defaults to whatever the bridge published (127.0.0.1:4317). |
--signals | Comma-separated subset of traces,metrics,logs. Useful for low-volume installs that only want metrics. |
--service-name | Resource attribute set on every emitted span. Defaults to defenseclaw. |
--with-audit-sink / --no-audit-sink | Also (or don't) add an audit_sinks: otlp_logs entry so audit events flow as OTel logs. Default is on. |
--no-config | Bring containers up but do not modify config.yaml. Useful when you manage gateway config out-of-band. |
--refresh-config / --no-refresh-config | Refresh bundled Grafana dashboards, Prometheus rules, Loki, Tempo, and OTel Collector config by default; opt out to preserve local edits. |
--no-wait | Don't block on healthchecks — fire-and-forget. |
--timeout | Seconds to wait for healthchecks. Default 180. |
The OTLP protocol is read from the bridge readiness contract (currently grpc); there is no --protocol flag on up. To use http/protobuf, configure that protocol on the named local-observability destination.
What ends up in config.yaml
The example below is the result of the sample up command using
--service-name defenseclaw-gateway; without that flag, service.name is
defenseclaw.
otel:
  enabled: true
  destinations:
    - name: local-observability
      preset: local-otlp
      enabled: true
      endpoint: 127.0.0.1:4317
      protocol: grpc
      tls: { insecure: true }
      traces: { enabled: true }
      metrics: { enabled: true }
      logs: { enabled: true }
  resource:
    attributes:
      service.name: defenseclaw-gateway

audit_sinks:
  - kind: otlp_logs
    name: local-otlp-logs
    endpoint: 127.0.0.1:4317
    protocol: grpc
    insecure: true
If a sink with the same name already exists, the bridge updates it in place rather than adding a duplicate. Other sinks (Splunk HEC, JSONL, webhooks) are left untouched.
Bundled Grafana dashboards
The bundle ships a full board set in bundles/local_observability_stack/grafana/dashboards/ — every *.json file here is auto-loaded:
| Dashboard (UID) | What it shows |
|---|---|
Overview (defenseclaw-overview) | KPI strip + firing alerts + SLO gauges; the landing board. |
Agent Activity (Live) (defenseclaw-activity) | Cross-agent prompts, models, tools, destinations, and session correlation. |
Connectors / Hook Connectors (defenseclaw-connectors) | Primary multi-connector view. Cross-connector compare: per-connector traffic, blocks, redactions, errors, hooks-vs-OTel drift. Filterable by the connector template variable. |
Connector Detail (defenseclaw-connector-detail) | Single-connector deep dive driven by $connector: identity, ingest, hooks, verdicts, judge, findings, HITL, scoped Loki streams. |
Guardrail Evaluations / Security (defenseclaw-security) | Verdict funnel by stage × action, severity breakdown, per-connector breakdown; connector-filterable. |
Policy decisions (defenseclaw-policy-decisions) | OPA verdicts by domain × verdict, egress branch, block-list hits. |
HITL (defenseclaw-hitl) | Chat HILT + exec approvals: approval/denial/timeout rates, pending gauge, MTTD. |
Findings (defenseclaw-findings) | Top rules, rule_id × time heatmap, finding-to-verdict correlation. |
Proxy & LLM Guard (defenseclaw-traffic) | HTTP surface latency/status, OTel ingest rates, trace samples. |
Scanners (defenseclaw-scanners) | Sparse-safe scan throughput and duration, errors by type, findings, and quarantine actions. |
Runtime & Reliability (defenseclaw-runtime) | Process, SQLite, exporter, audit-sink, and canonical gateway-error health. |
Agent identity (defenseclaw-agent-identity) | Three-tier agent identity correlation, churn, discovery latency, per-connector header presence. |
Agent360 (defenseclaw-agent-360) | Automatic Agent Directory plus one-click per-agent/tree lifecycle, executions, descendants, model calls, tools/websites, inputs/outputs, reported tokens/cost, security decisions, Tempo waterfall, and agent/subagent/model/tool topology. |
AI Agent Usage & Detection (defenseclaw-ai-discovery) | Continuous AI inventory loop: active signals, per-vendor/product tables, confidence. |
See the complete Grafana dashboard catalog for the owner and purpose of every board, the drill-down map, backend usage, and the exact difference between 0, No data, and Not reported.
For a multi-connector gateway, start on Connectors (Overview) to compare connectors side by side, then click a connector cell to drill into Connector Detail.
Agent Directory and Agent360
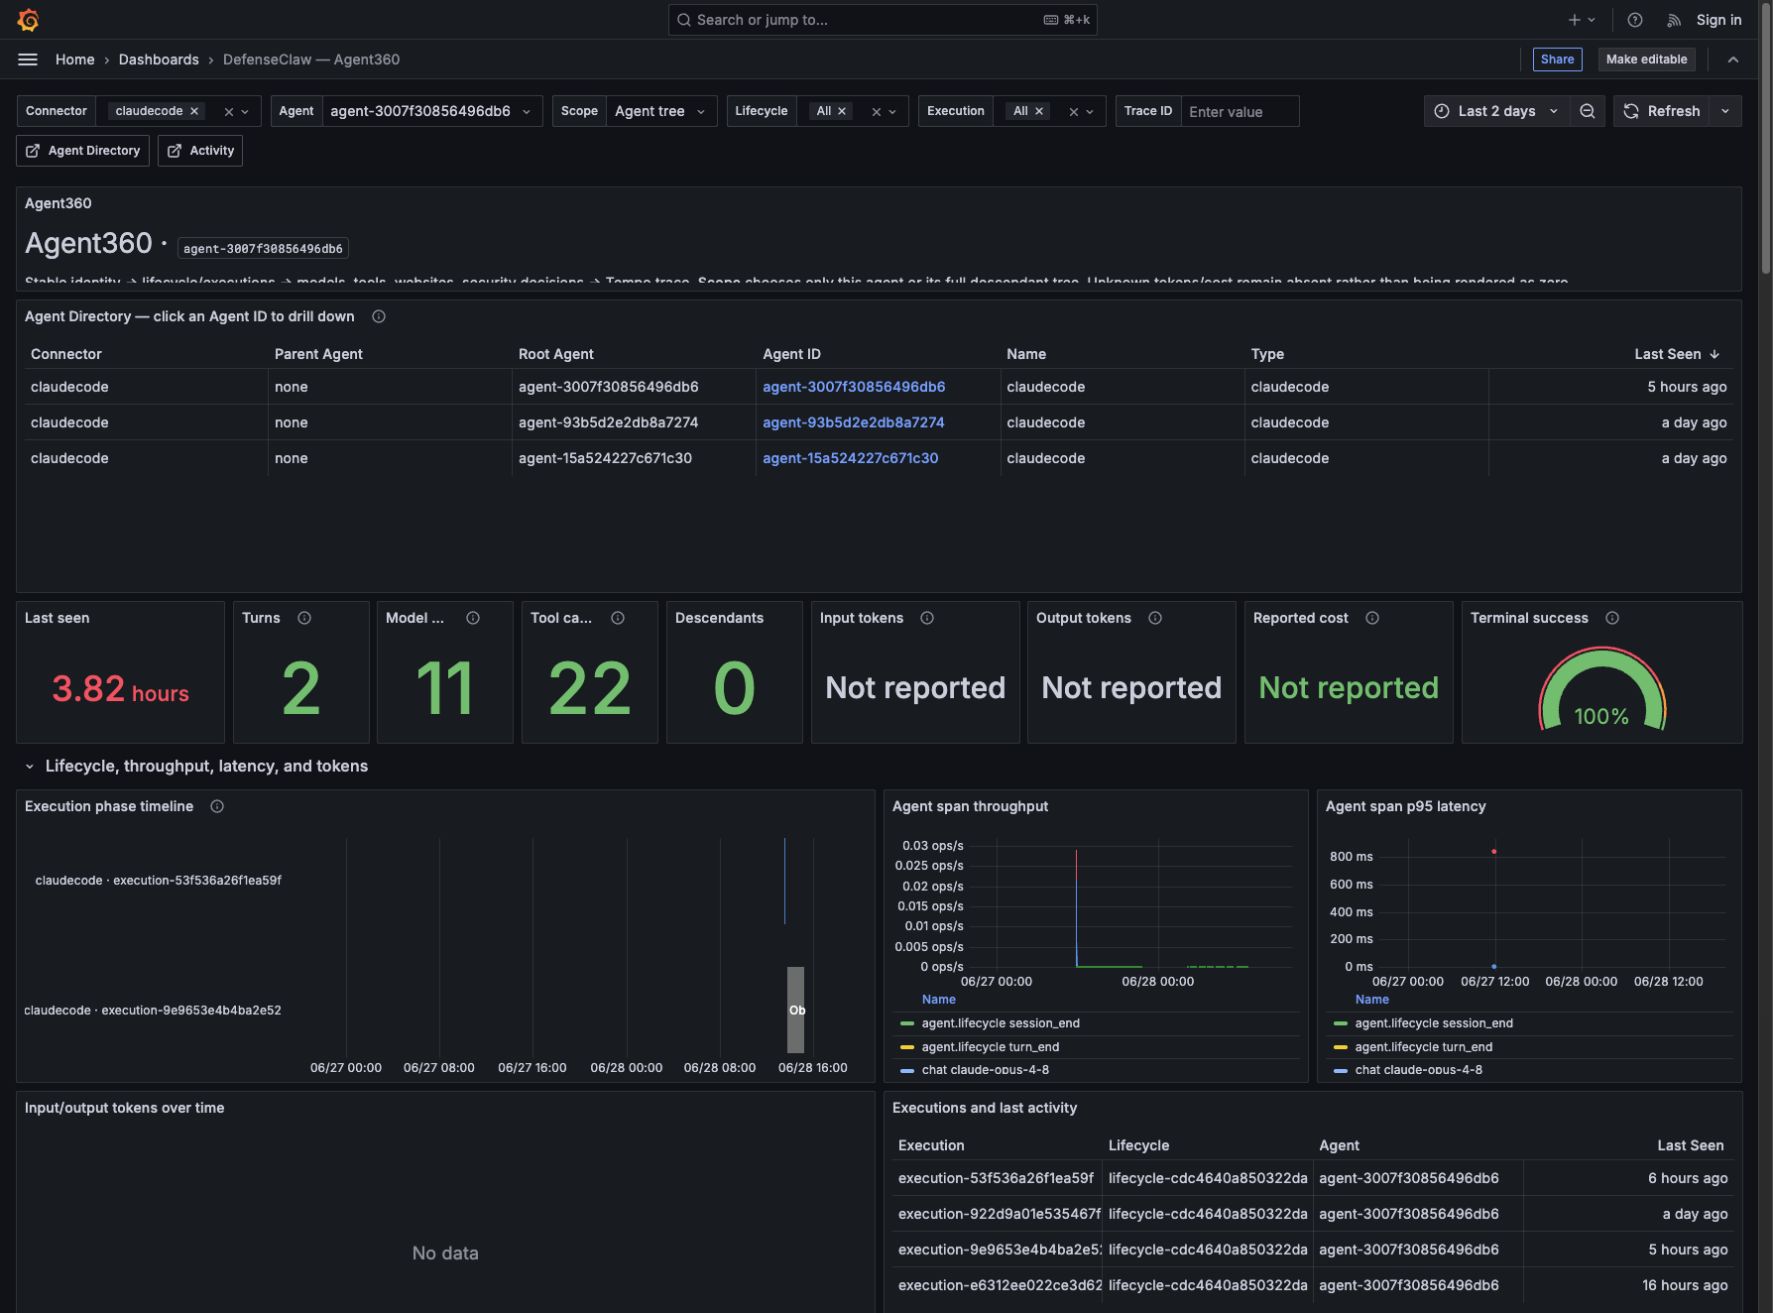
Open Agent identity → Runtime Agent Directory. Every hook lifecycle
transition updates the stable defenseclaw.agent.last_seen inventory metric,
so a newly observed root agent or subagent appears automatically. Click its
Agent ID to open the reusable Agent360 dashboard; DefenseClaw does not
create or provision a separate dashboard file for each agent.
Agent360 correlates the same stable fields across all three backends:
| Correlation | Purpose |
|---|---|
gen_ai.agent.id | One logical root or delegated agent. |
defenseclaw.agent.root.id / parent.id | Full descendant tree and direct parent relationship. |
defenseclaw.agent.lifecycle.id | Durable identity across gateway restarts and resumed sessions. |
defenseclaw.agent.execution.id | One concrete execution attempt. |
trace_id | Direct Loki/Prometheus exemplar pivot into the Tempo waterfall. |
Use Scope = This agent for a single agent, or Agent tree to include all descendants. Prometheus supplies directory, state, throughput, latency, token, reported-cost totals, and the dynamic agent/subagent/model/tool graph. Loki supplies compact lifecycle/model/tool/network/security summaries with the full event available in log details. Tempo supplies the complete request waterfall; the trace view also exposes Grafana's built-in span graph. Select a row in Recent traces to populate the waterfall. Token and cost panels only display values explicitly reported by the connector. Input tokens include the prompt/context usage reported by the provider and may be much larger than output for long-context agents. Missing values remain Not reported and are never estimated.
See the Agent360 dashboard guide for a visual tour of every section, the agent/model/tool topology, trace drill-down, and the difference between 0, No data, and Not reported.
They're auto-provisioned via bundles/local_observability_stack/grafana/provisioning/. The folder is named "DefenseClaw" inside Grafana so they're easy to find. Edits you make in the UI are not persisted back to disk by default — copy them out with Dashboard → JSON Model if you want to keep them.
Tear it down
defenseclaw setup local-observability downStops all five containers and removes the Compose project. Dashboards and Grafana state live in named Docker volumes so they survive down/up cycles.
To wipe everything including the volumes:
defenseclaw setup local-observability reset --yesreset is destructive — your historical traces, logs, and metrics
go with it. Splunk HEC and JSONL sinks are unaffected. down only stops
the containers; named Docker volumes survive across down/up cycles
until you run reset.
Status and logs
defenseclaw setup local-observability status
defenseclaw setup local-observability logs --service grafana --follow
status shows container health and the resolved OTLP endpoint. logs --service <name> tails one of the five containers — useful when Grafana isn't picking up dashboards or the OTel collector is dropping spans. Drop --service to fan out logs from every container at once.
Use it alongside Splunk
Local observability and Splunk are independent sinks. A common pattern:
- Engineers and SREs use the local Grafana stack for live investigation.
- The same gateway also forwards every event to the org Splunk for retention and SOC.
Just run both setup commands — they edit different blocks in config.yaml:
defenseclaw setup local-observability up
defenseclaw setup splunk --enterprise --hec-endpoint ... --hec-token ...
See Splunk integration for the dashboards we ship for the local Splunk app and for tips on building your own SPL queries against the gateway sourcetypes.
Troubleshooting
Observability
Every prompt, tool call, scan finding, and HITL decision lands in your SIEM and your dashboards. DefenseClaw ships local Grafana/Loki/Tempo and local Splunk stacks you can stand up with one command.
Grafana dashboard catalog
A complete map of the DefenseClaw Grafana dashboards, who each board is for, which telemetry rail it uses, how drill-downs connect, and how to interpret empty panels.