Splunk
defenseclaw setup splunk runs three independent pipelines — a local Splunk in Docker for demos, remote Splunk Enterprise via HEC, and Splunk Observability Cloud via OTLP. Five demo dashboards are bundled.
DefenseClaw ships a single command — defenseclaw setup splunk — with three independent pipelines you can mix and match:
| Pipeline | Use case | What it does |
|---|---|---|
--logs | Local demo / dev | Brings up Splunk Free in Docker, installs the bundled local-mode app, sends events via HEC |
--enterprise | Production SIEM | Configures the gateway's HEC sink to point at your Splunk; no Docker, no install |
--o11y | Splunk Observability Cloud | Sends OTLP traces / metrics / logs to your realm |
You can run more than one. They write to different blocks in ~/.defenseclaw/config.yaml, so adding one never undoes another.
Local mode (--logs)
The fastest path to a working Splunk demo. One command brings up Splunk Free 9.x in Docker, installs the bundled defenseclaw_local_mode app (with five dashboards), and points the gateway's HEC sink at it.
defenseclaw setup splunk --logs --accept-splunk-licenseWhat happens:
License check. Without --accept-splunk-license the CLI prompts you interactively. Use --non-interactive for CI.
Docker preflight. Verifies Docker is running and that ports 8000 (Splunk Web) and 8088 (HEC) are free.
Bridge bootstrap. splunk-claw-bridge up (shipped in bundles/splunk_local_bridge/) launches the container, waits for /services/server/info, and provisions an HEC token.
Sink wiring. Writes a splunk_hec audit sink into config.yaml pointing at http://127.0.0.1:8088/services/collector/event, index defenseclaw_local, sourcetype defenseclaw:json.
App install. Copies bundles/splunk_local_bridge/splunk/apps/defenseclaw_local_mode into the container — five dashboards plus shared SPL macros.
Open Splunk at http://localhost:8000 (default credentials are surfaced by defenseclaw setup splunk --show-credentials). The bundled app shows up as DefenseClaw (local mode).
Bundled dashboards
Five dashboards land under Demo Dashboards in the app navigation. They're the same ones you'd build by hand against a real production deployment, just pointed at the local index for a self-contained demo.
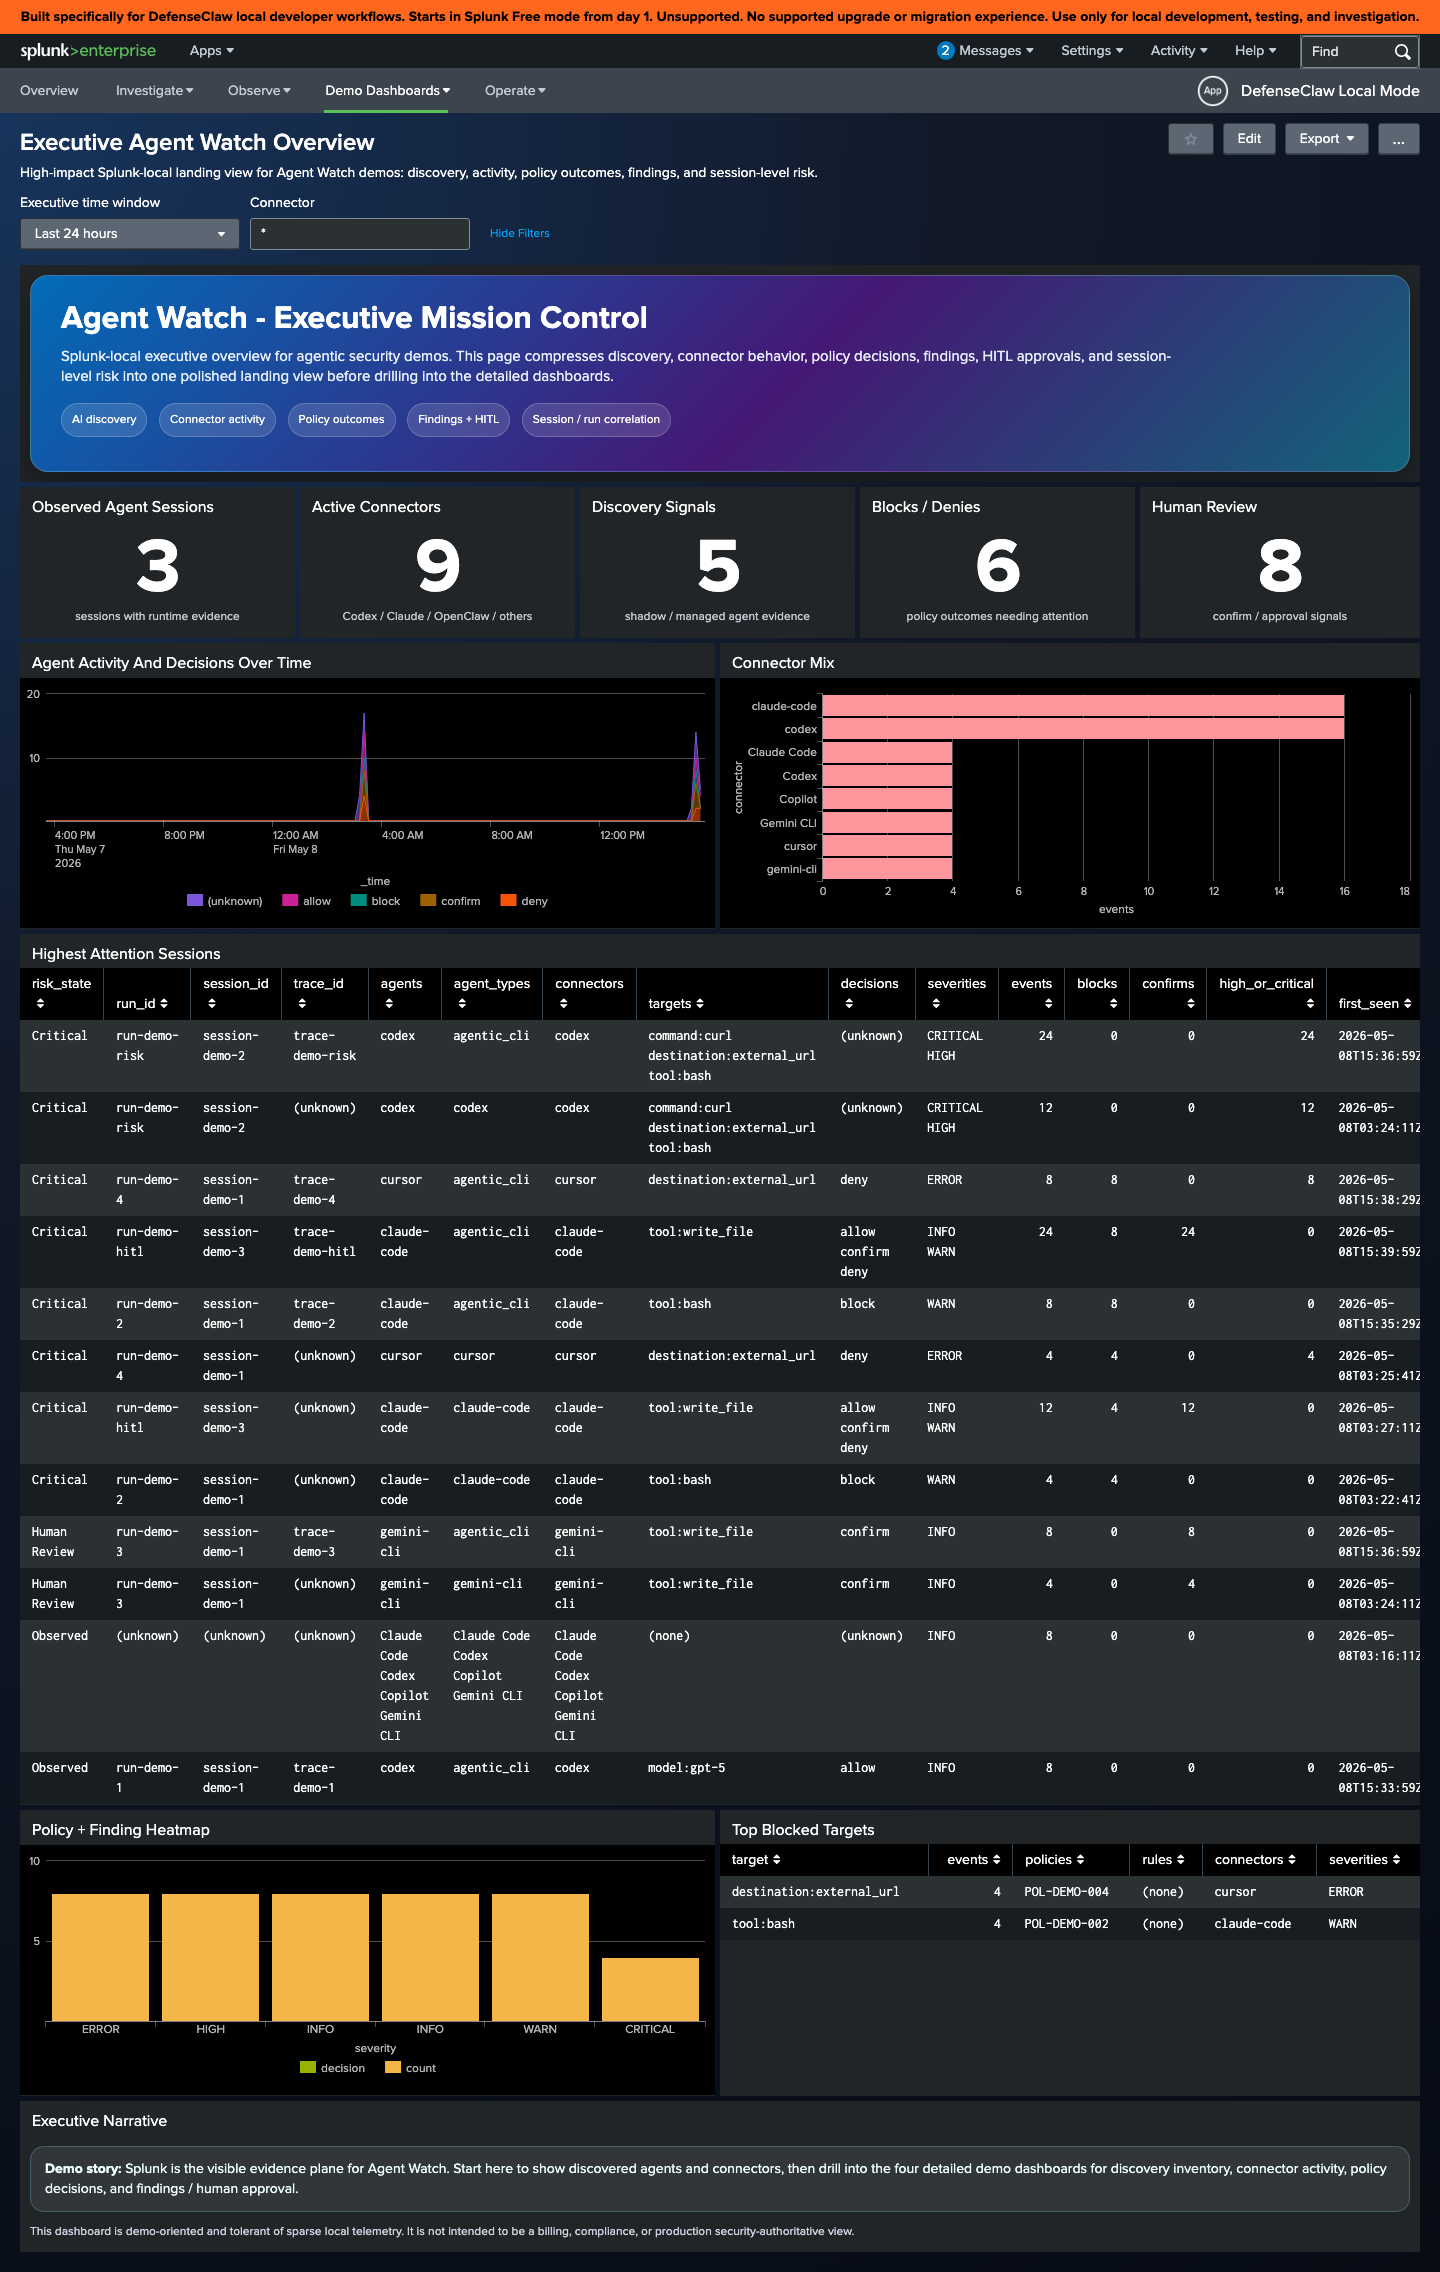
Executive Agent Watch Overview
The CISO-friendly landing page: high-attention sessions, blocked actions, scanner heat, HITL backlog.
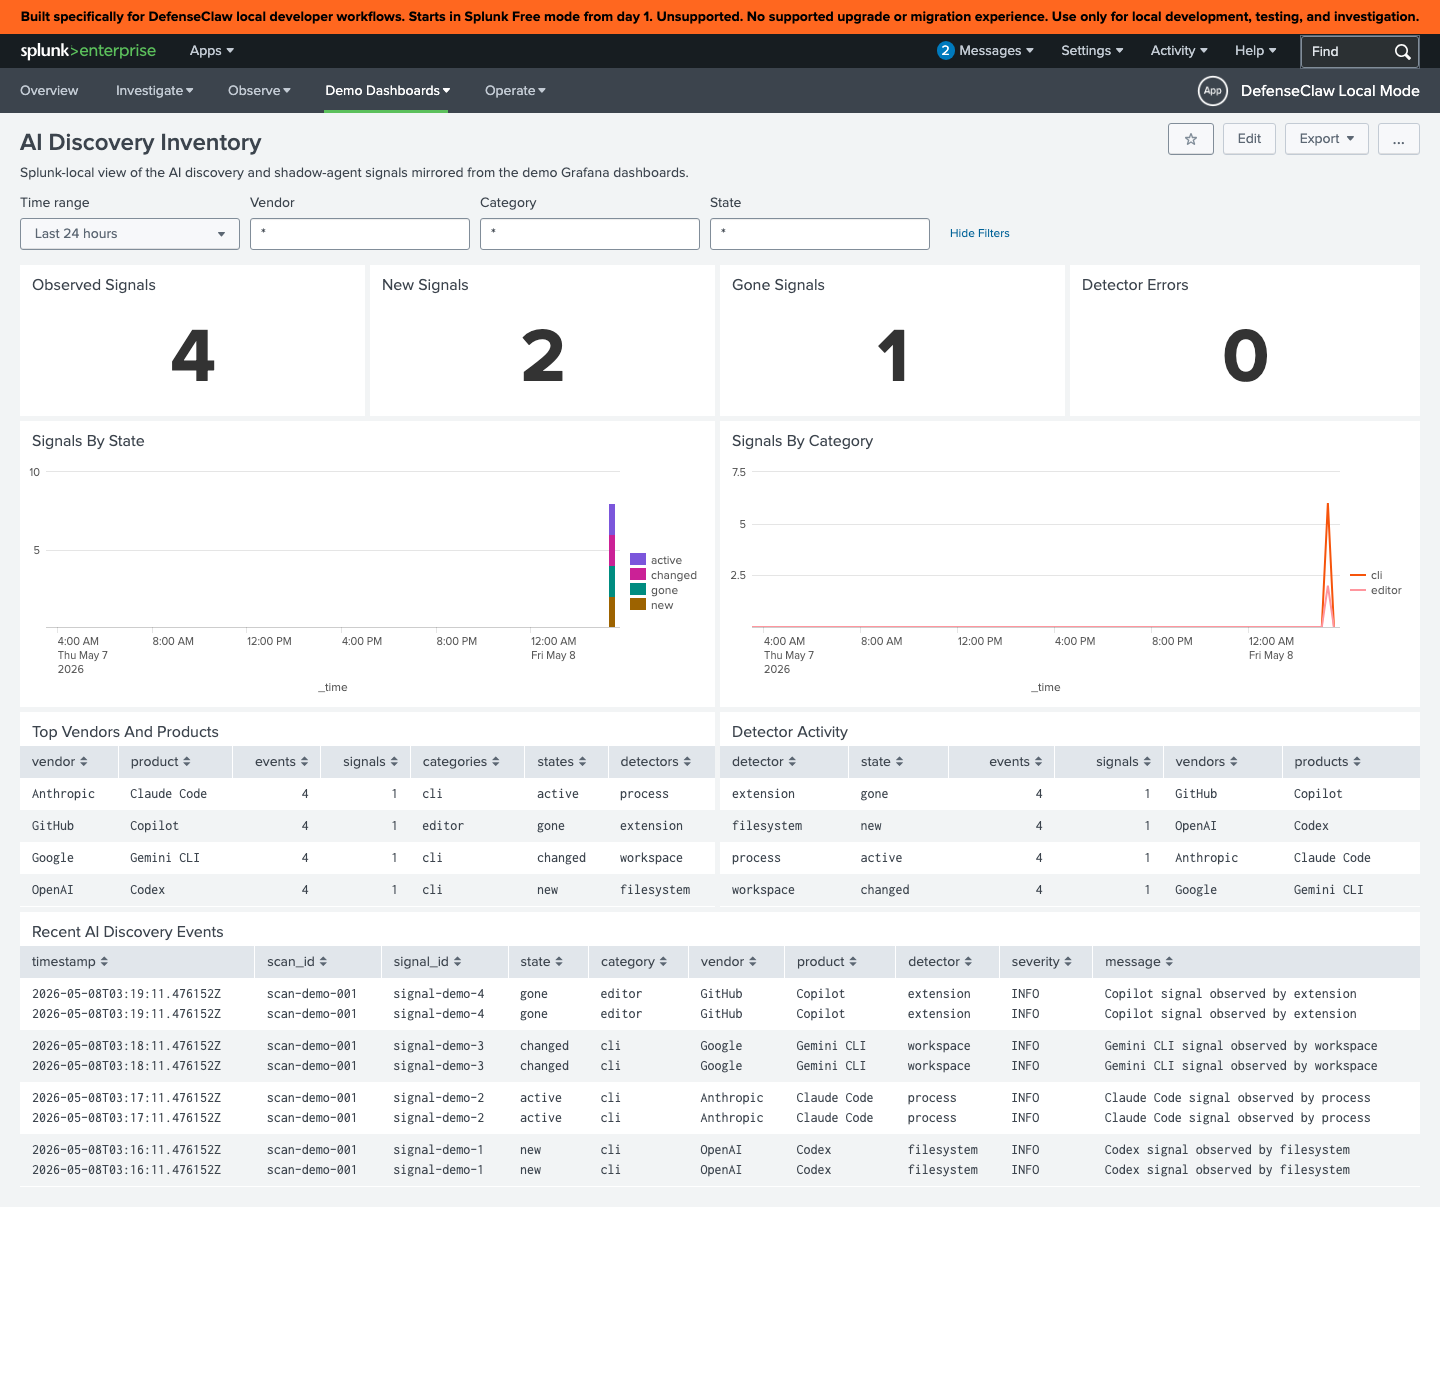
AI Discovery Inventory
What agents are running, which models they call, and which scanners have evaluated them. Useful as the "first thing the SOC sees" panel.
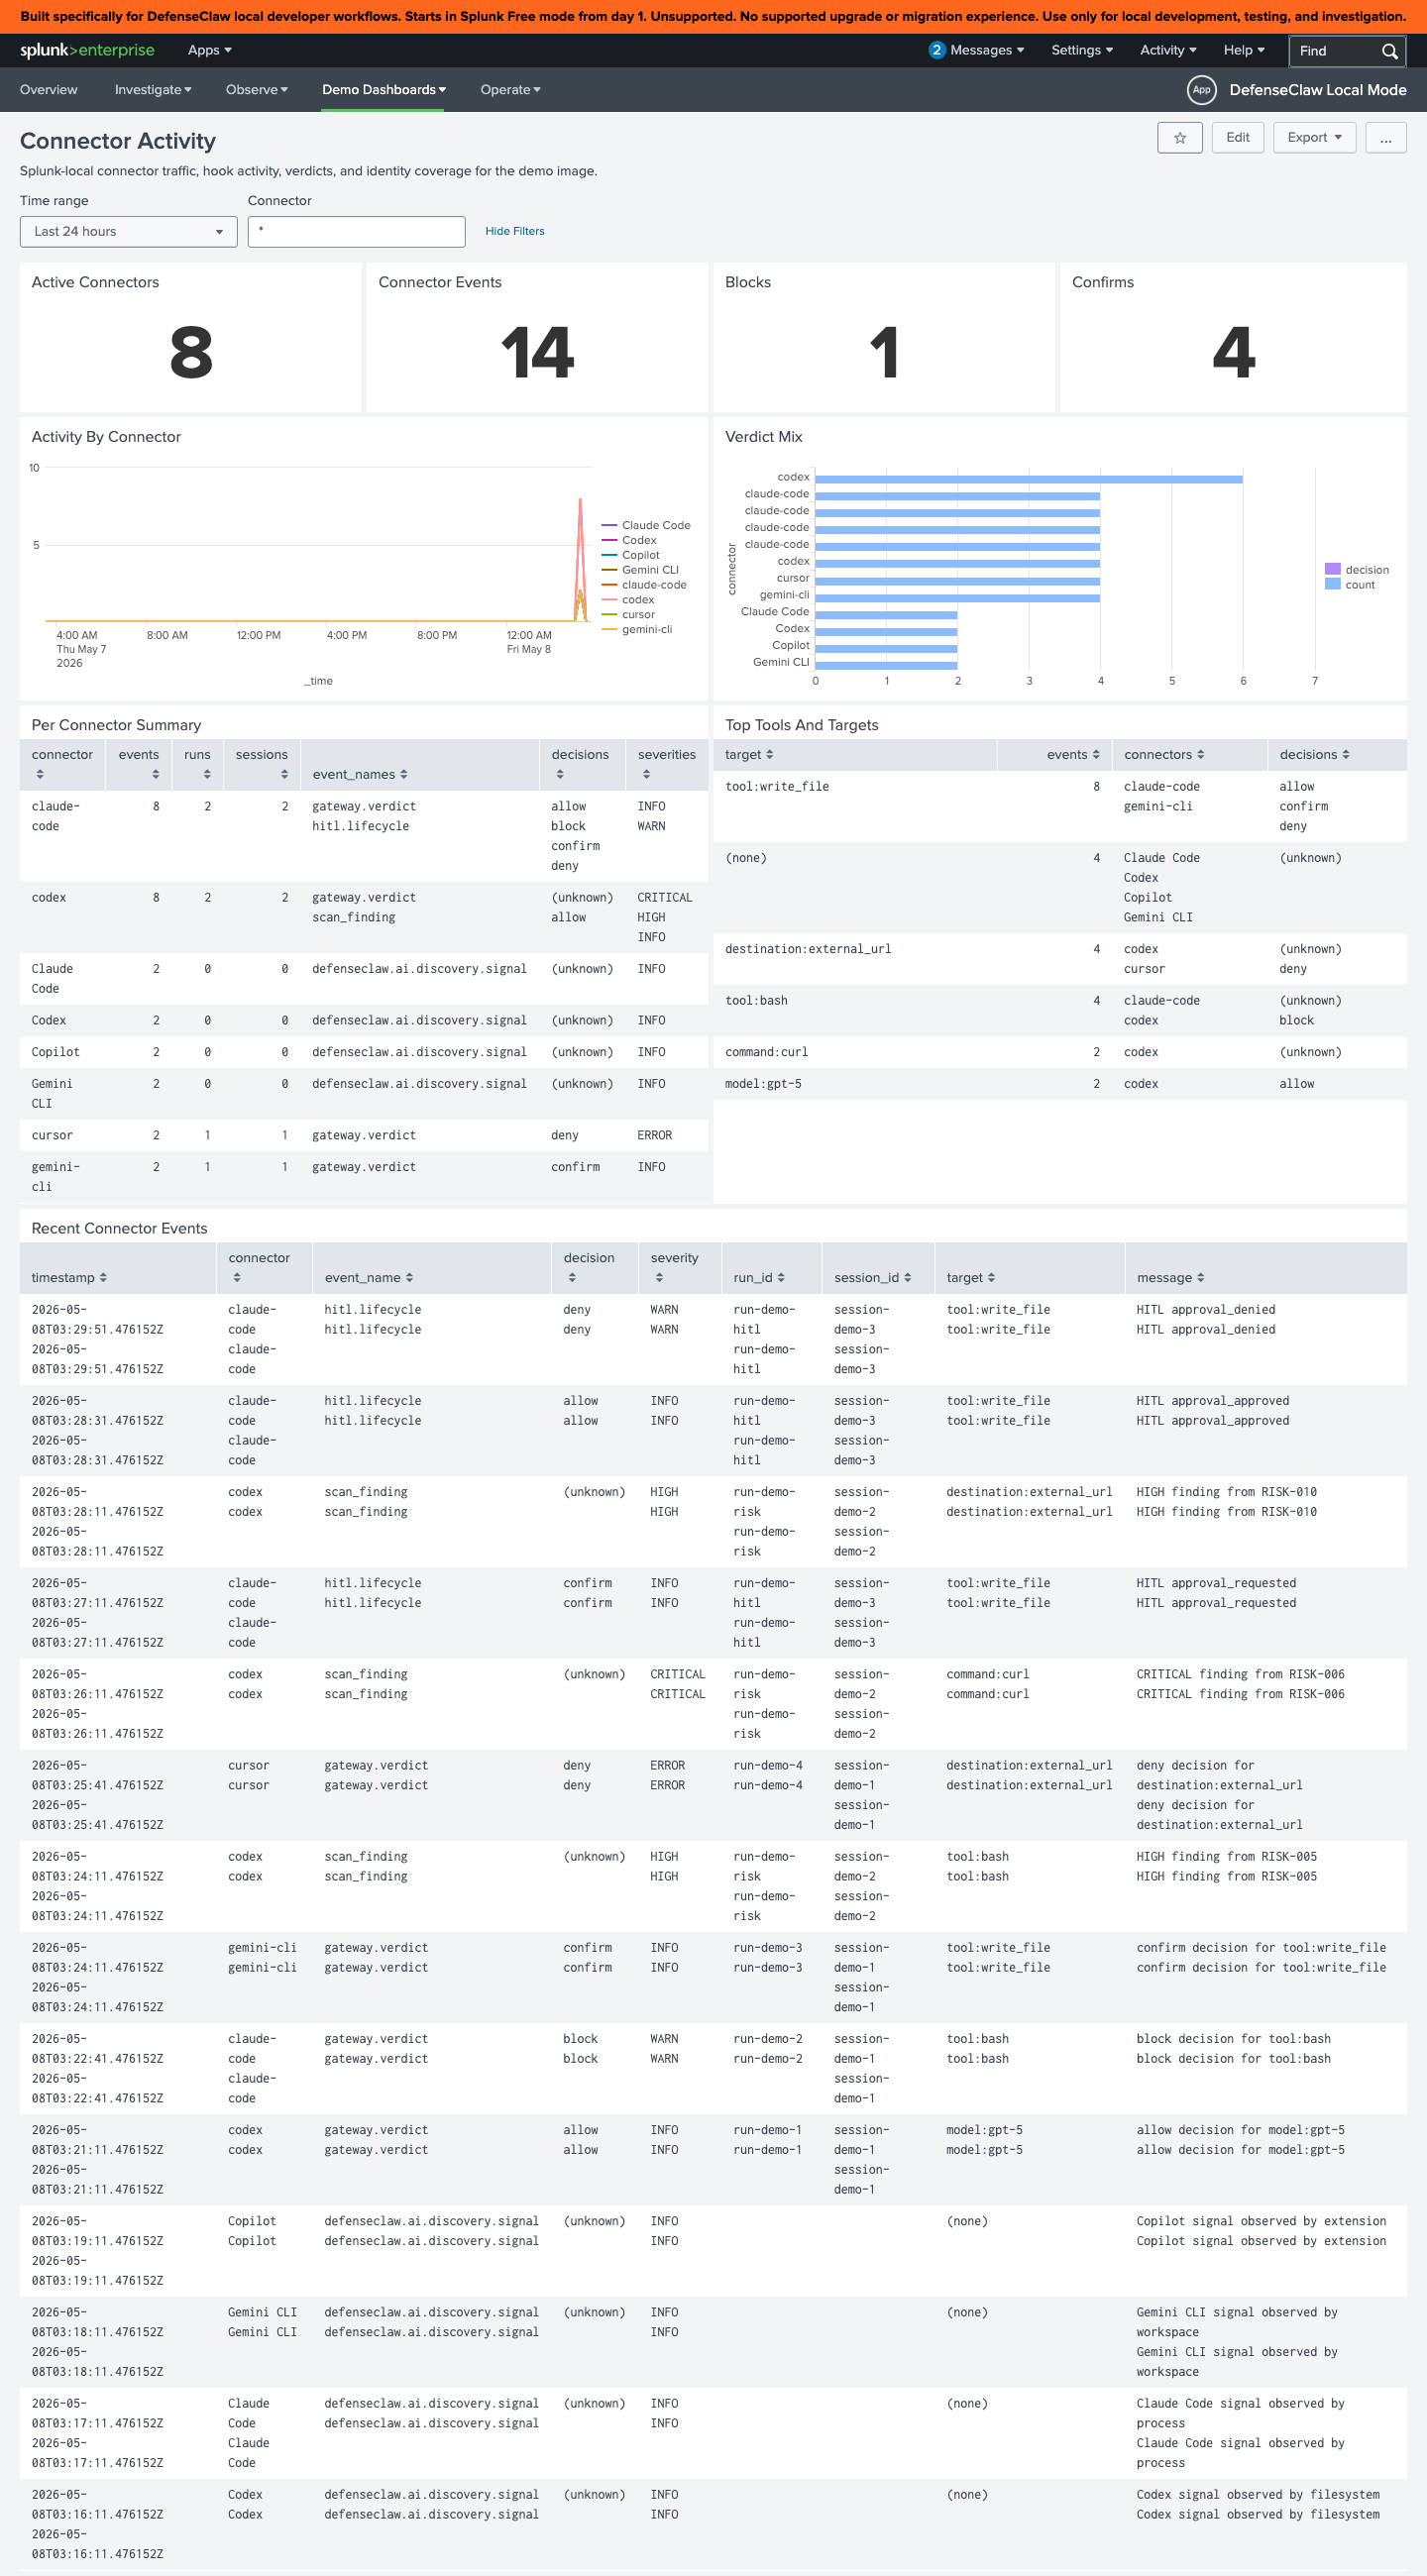
Connector Activity
Per-connector throughput, error rate, and policy hit ratios over time. Helps catch a connector that suddenly starts triggering rules.
On multi-connector installs, this is the fastest dashboard for comparing hook volume, errors, and policy hits across the active roster.
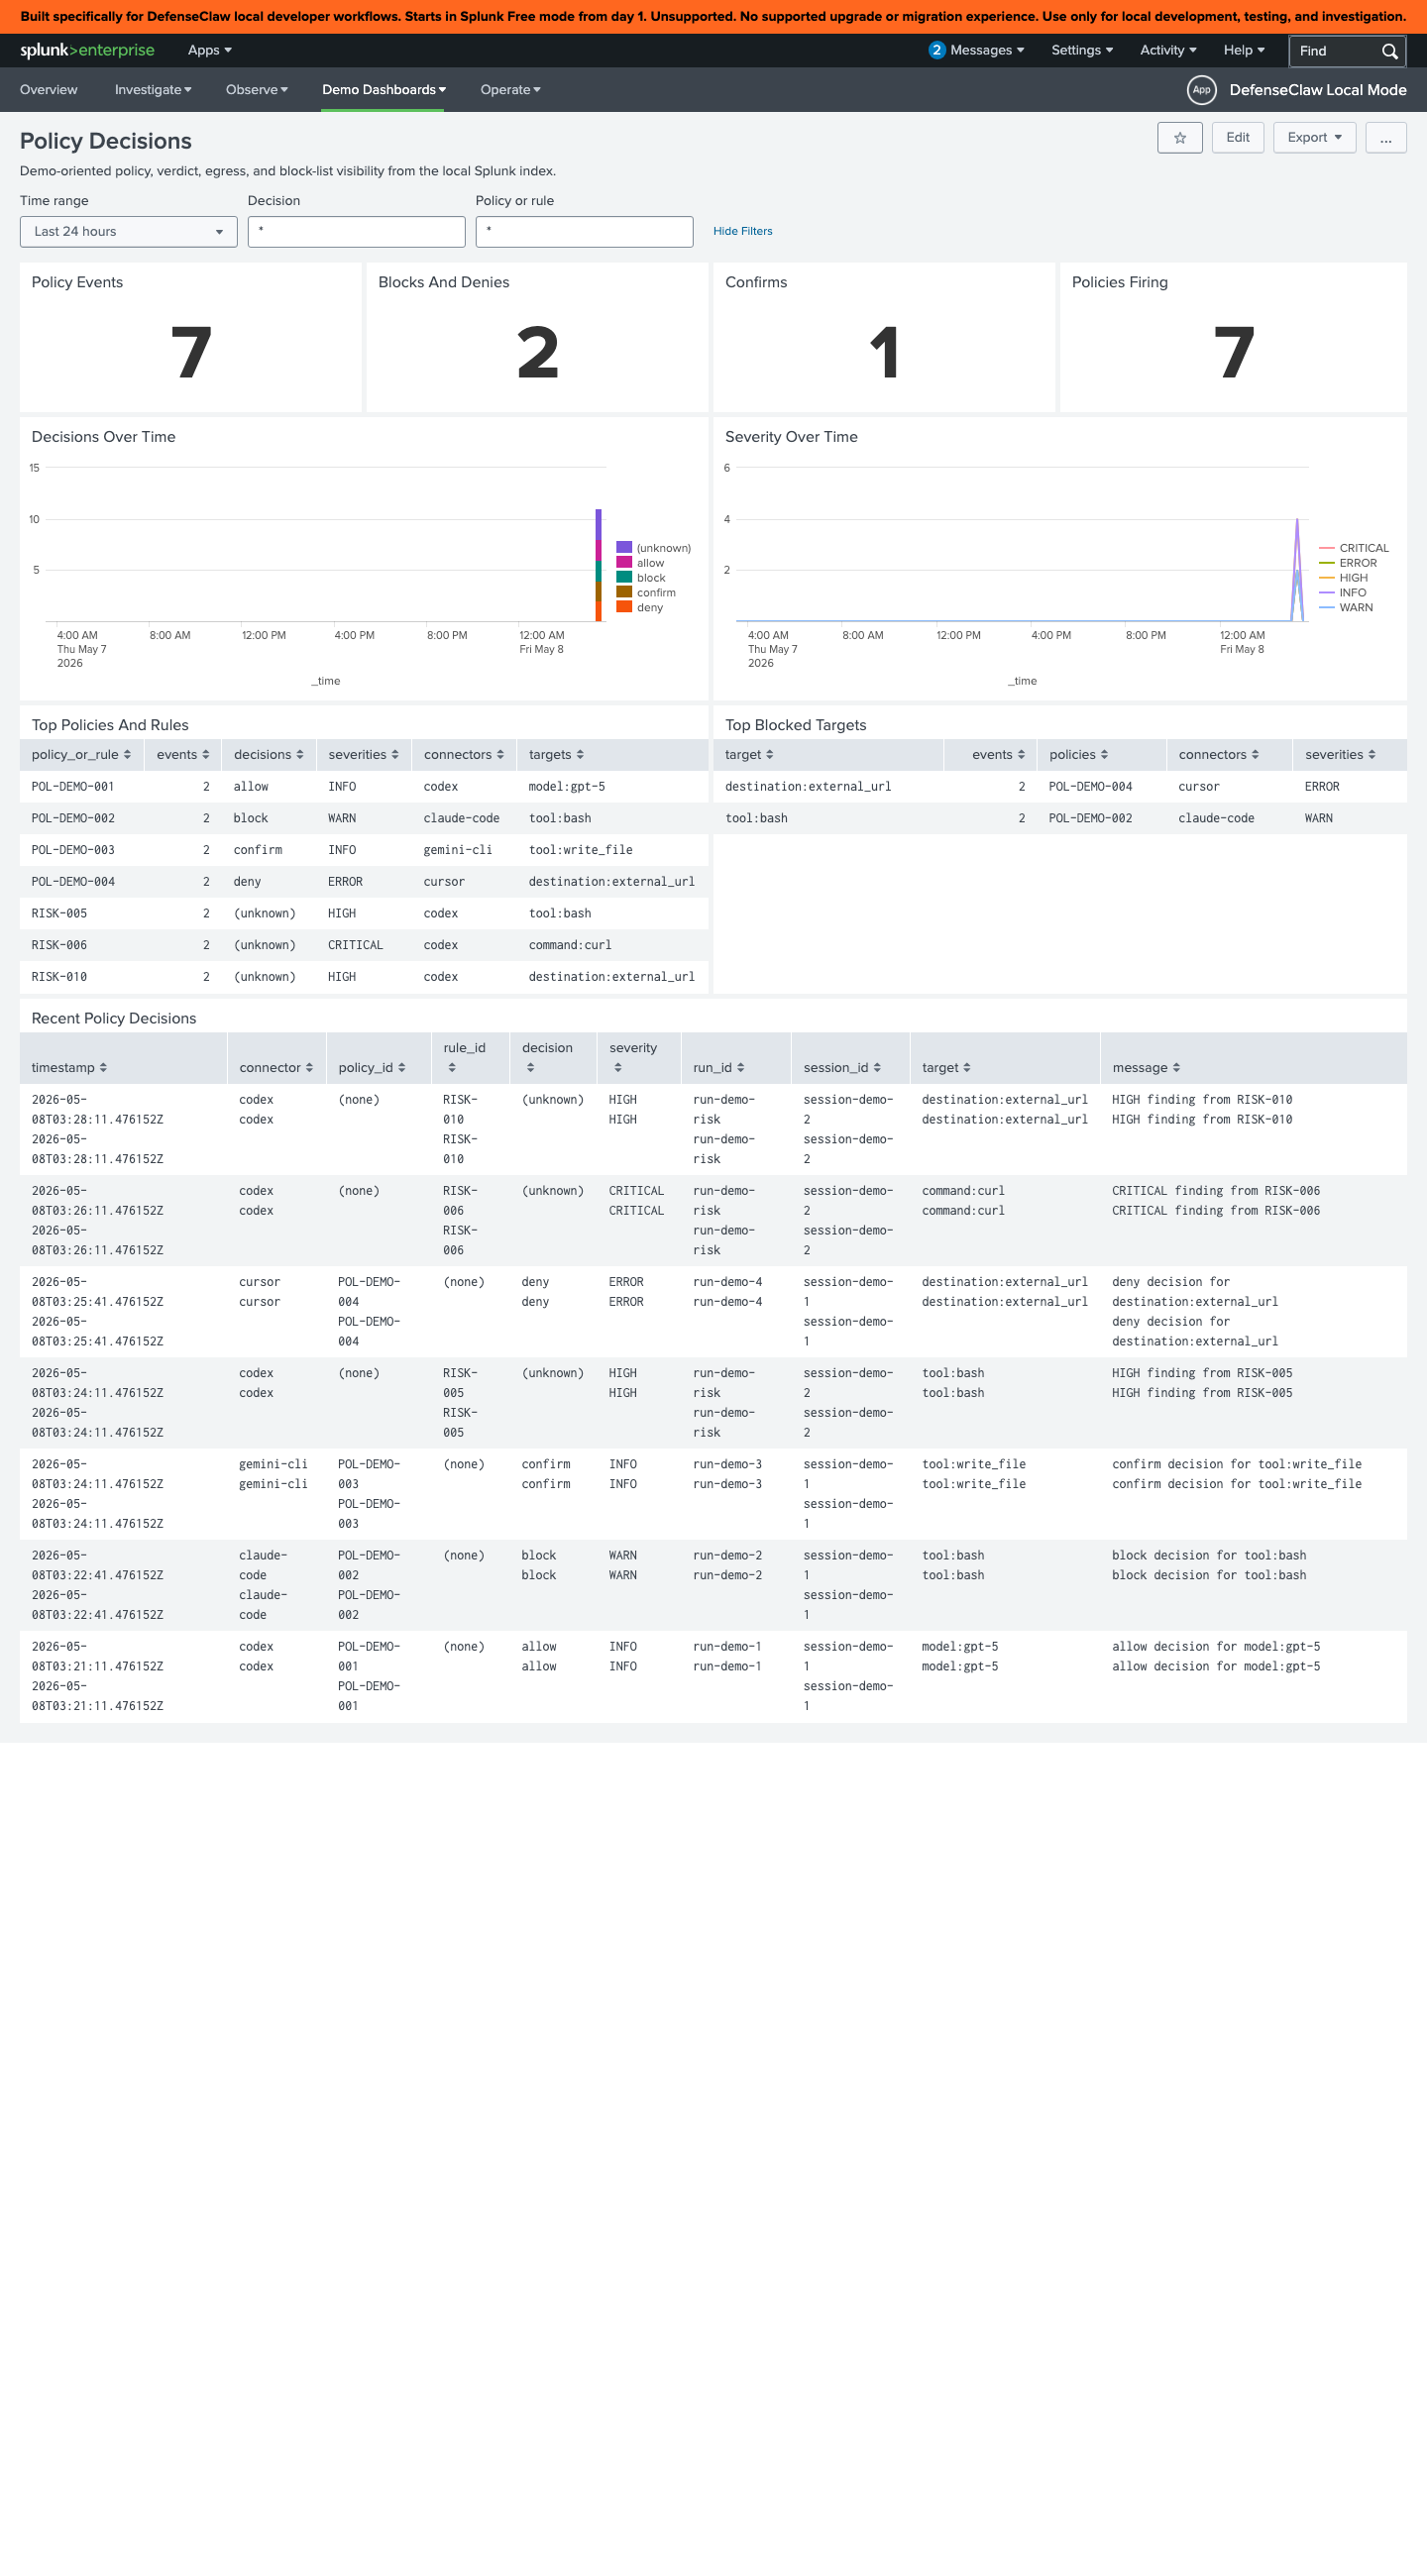
Policy Decisions
Every guardrail verdict, broken down by rule, severity, and outcome. The "did this actually fire?" view when you tune a rule pack.
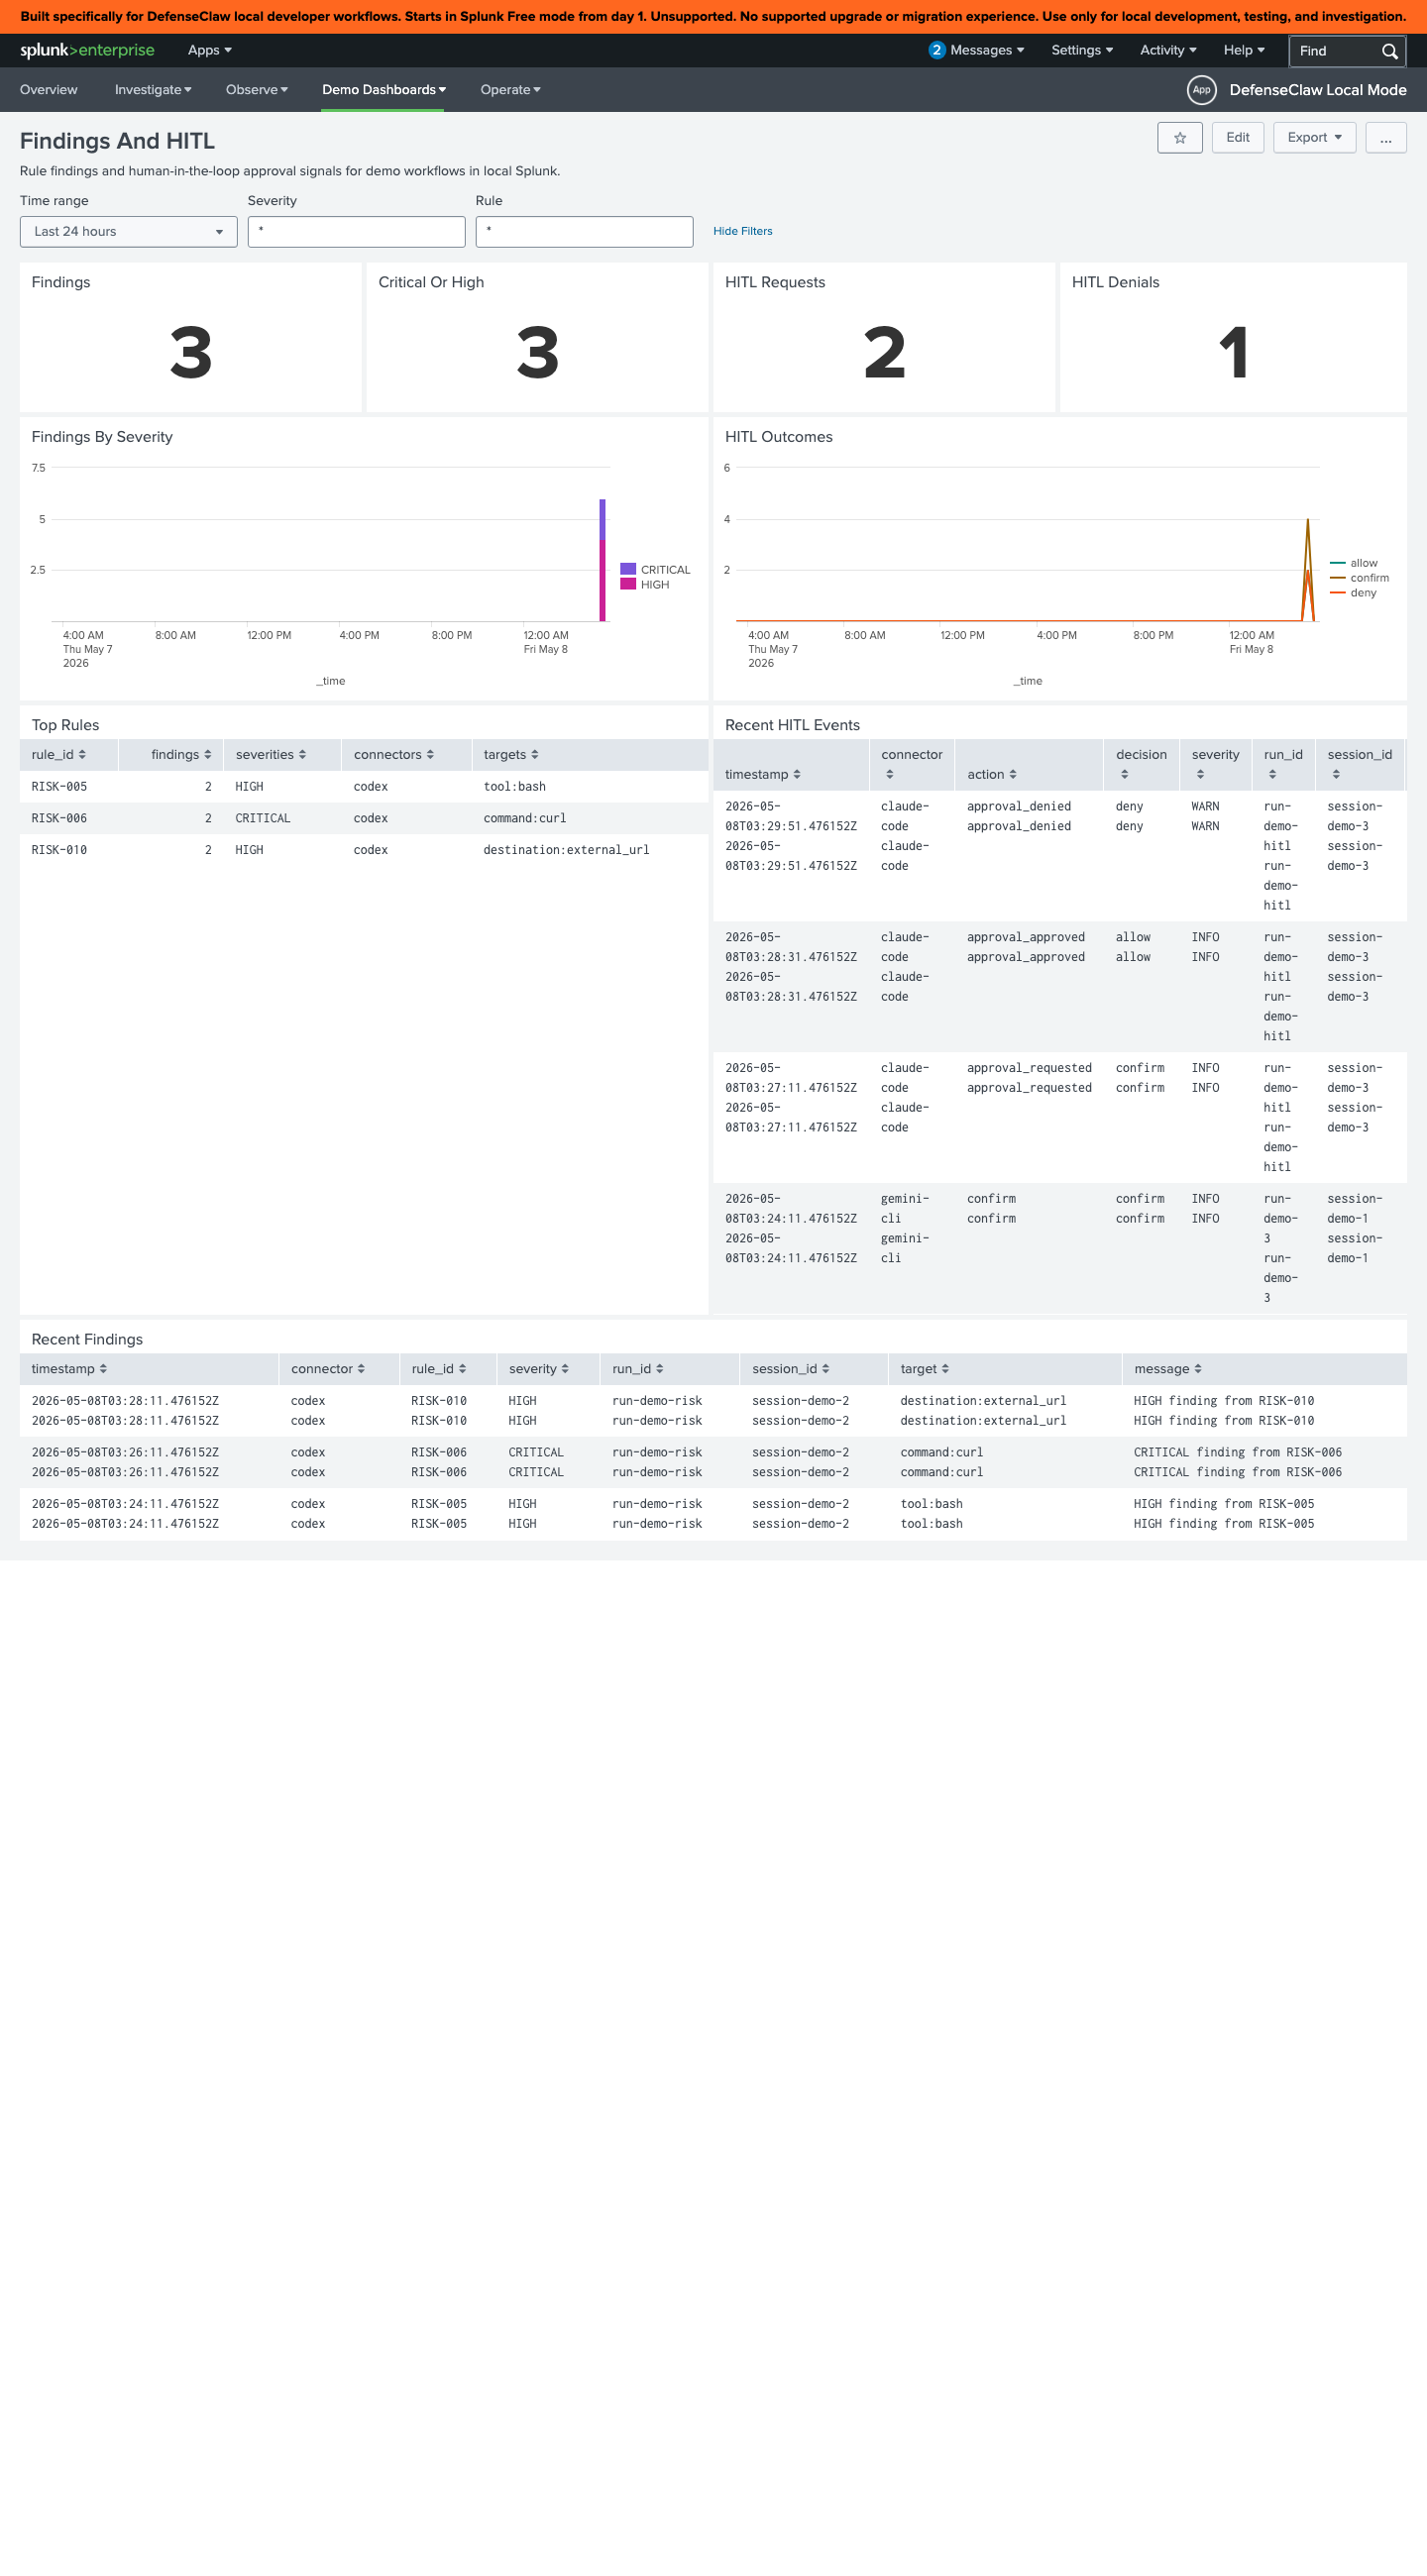
Findings and HITL
Open scanner findings plus HITL request/decision history. This is an observability view, not a resumable approval queue; live approval happens only on connector events with a native ask surface.
What the dashboards query
All five views read from a shared set of SPL macros under bundles/splunk_local_bridge/splunk/apps/defenseclaw_local_mode/default/macros.conf, scoped to index=defenseclaw_local. The macros normalize the gateway's JSON envelope so the dashboards don't have to repeat field extractions.
The gateway ships audit events: the discriminator is the top-level action field (the audit.Action enum — connector-hook, guardrail-block, guardrail-verdict, approval-request, …), not a kind field. The connector dimension lives in the top-level connector field and, on hook rows, in structured.connector.
Useful starting queries:
index=defenseclaw_local sourcetype=defenseclaw:json action="connector-hook" structured.connector="codex"
| stats count by structured.event_type, structured.action, structured.would_block
| sort -countindex=defenseclaw_local sourcetype=defenseclaw:json action="guardrail-block"
| stats count by connector, structured.rule_id, structured.severity
| sort -countindex=defenseclaw_local sourcetype=defenseclaw:json action="connector-hook"
| timechart span=5m count by structured.connectorEnterprise mode (--enterprise)
Send events to an existing Splunk deployment. No Docker, no app install — just configure the HEC sink.
defenseclaw setup splunk --enterprise \
  --hec-endpoint https://splunk.example.com:8088 \
  --hec-token "$DEFENSECLAW_SPLUNK_HEC_TOKEN" \
  --index defenseclaw \
--sourcetype _json| Flag | Purpose |
|---|---|
--hec-endpoint | Full HEC URL ending in /services/collector/event. The CLI accepts both bare host and full URL. |
--hec-token | HEC token. Reads DEFENSECLAW_SPLUNK_HEC_TOKEN if omitted. |
--index | Defaults to defenseclaw. Create it ahead of time. |
--sourcetype | Defaults to _json. Use defenseclaw:json if you've imported the bundled macros. |
--app-name | Pretty name shown in the gateway TUI as the sink label. |
--skip-test | Skip the live HEC probe (useful in air-gapped CI). |
The CLI runs a one-shot probe by default — it sends a test event and confirms HEC returns 200 before persisting the config. If your HEC is behind a VPN, pass --skip-test.
Field mapping in your Splunk
The events arrive as JSON with the envelope described in Observability. For Splunk Cloud or Splunk Enterprise without the bundled app, you'll typically want:
[defenseclaw:json]
KV_MODE = json
TIME_PREFIX = "ts":"
TIME_FORMAT = %Y-%m-%dT%H:%M:%S.%QZ
SHOULD_LINEMERGE = false

LOOKUP-decision = decision_lookup decision
EXTRACT-trace = trace_id="(?<trace_id>[0-9a-f]+)"
We don't ship a transforms-only TA today; the local-mode app stays Splunk-Free-friendly so you can copy fields out as needed.
Splunk Observability Cloud (--o11y)
For organizations standardised on Splunk O11y instead of Splunk Enterprise, the gateway's OTel exporter sends to the OTLP HTTP ingest endpoint:
defenseclaw setup splunk --o11y \
  --realm us1 \
  --access-token "$SPLUNK_ACCESS_TOKEN" \
  --traces --metrics --logs
This writes the otel: block in config.yaml (same as setup local-observability, but pointed at https://ingest.us1.signalfx.com). Toggle individual signals with --no-traces / --no-metrics / --no-logs if you don't pay for all three.
Disable
defenseclaw setup splunk --disable --logs
defenseclaw setup splunk --disable --enterprise
defenseclaw setup splunk --disable --o11y
--disable removes the matching block from config.yaml (and stops the local container if you ran --logs). It does not touch other sinks.
Verify
defenseclaw doctor

tail -f ~/.defenseclaw/gateway.jsonl | jq 'select(.kind == "guardrail.verdict")'
doctor confirms the HEC endpoint is reachable and the token is valid. The JSONL tail mirrors what's being shipped to Splunk (the gateway writes the same payload to local JSONL and remote sinks) — useful when you suspect a sink is dropping events.
Troubleshooting
See also
- Local observability stack — the OTel + Grafana sibling
- Defaults — what the gateway emits before you tune anything
- Reference → Configuration — every audit-sink schema
Galileo
Send DefenseClaw GenAI traces to Galileo Cloud or self-hosted Galileo while keeping local observability enabled.
Stories
Concrete walkthroughs for the things people actually want — block rm -rf on Claude Code, catch a prompt injection on Codex, stop secret exfiltration from Cursor, approve risky tool calls, pin local observability, and switch connectors without losing audit history.