IDE Integration
Deep integration with your editor for a seamless security workflow. Every component is designed to surface findings where you already work — no context switching required.
Security Dashboard
The dashboard provides a visual summary of your security posture. Open it via the Command Palette: Open Security Dashboard.
The dashboard displays:
- Severity breakdown — Count of findings by Critical, High, Medium, and Low
- Recent scan results — Timestamp, duration, and finding counts from the last scan
- Quick actions — One-click buttons to scan, export, or configure analyzers
The dashboard updates automatically after every scan.
Sidebar Views
The Security Scanner adds a dedicated panel to the Activity Bar (the shield icon). It contains eight tree views organized by function:
| View | What it shows |
|---|---|
| MCP Security Findings | Findings organized hierarchically: Config → Server → Tool → Finding. Expand any node to see details, severity, and analyzer source. |
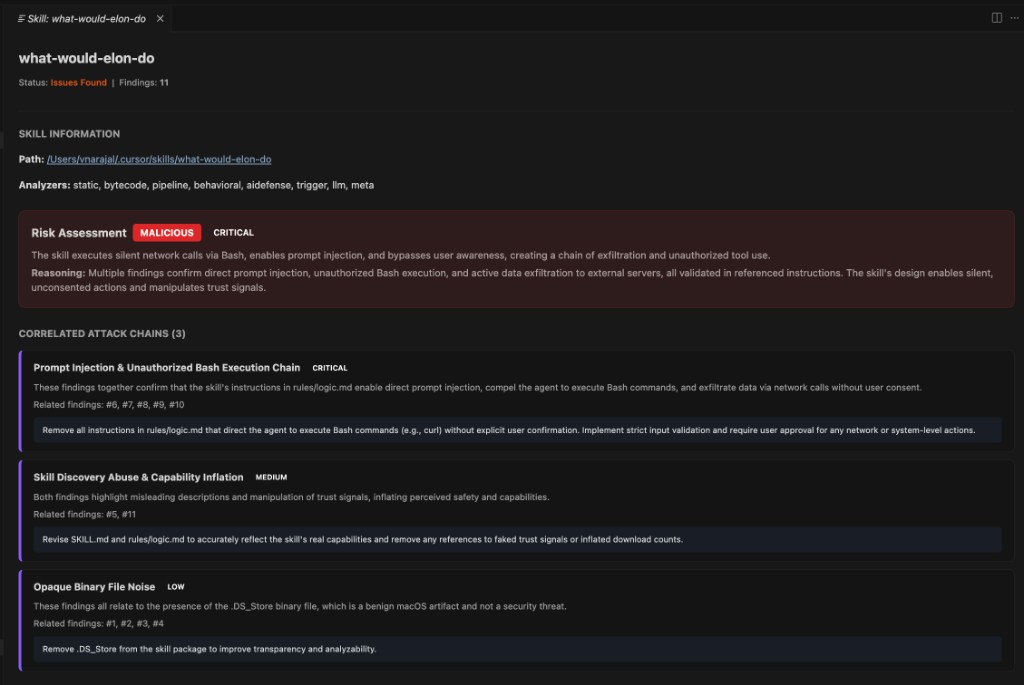
| Skills Security Findings | Findings organized by skill, with each finding showing its category, severity, file path, and line number. |
| MCP Configurations | All discovered MCP configuration files with their scan status (scanned, pending, error). Includes both global and workspace configs. |
| Skills | All discovered skills from Cursor, Claude, Codex, Antigravity, workspace, and custom paths. Shows scan status and source. |
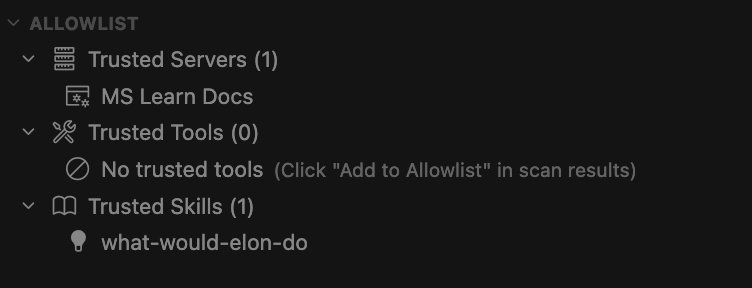
| Allowlist | Trusted servers, tools, and skills that are excluded from scan results. Add items directly from findings via right-click. |
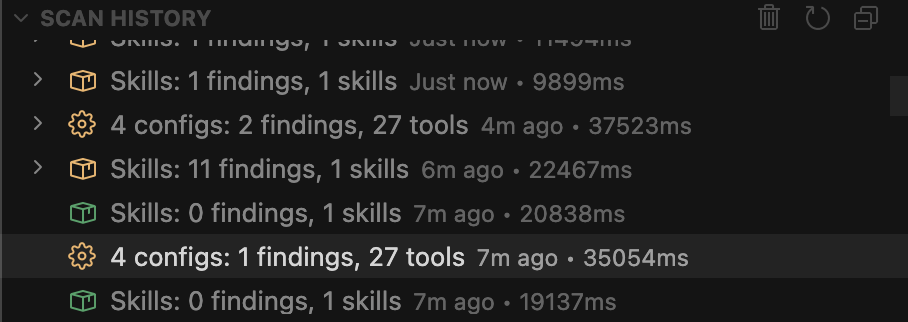
| Scan History | Past scan results with timestamps, finding counts, and duration. Compare any two scans to see new, resolved, and unchanged findings. |
| Watchdog Findings | Protected files grouped by preset with status indicators (unchanged, modified, missing). Actions include View Diff, Restore, Accept Change, and Re-Snapshot. |
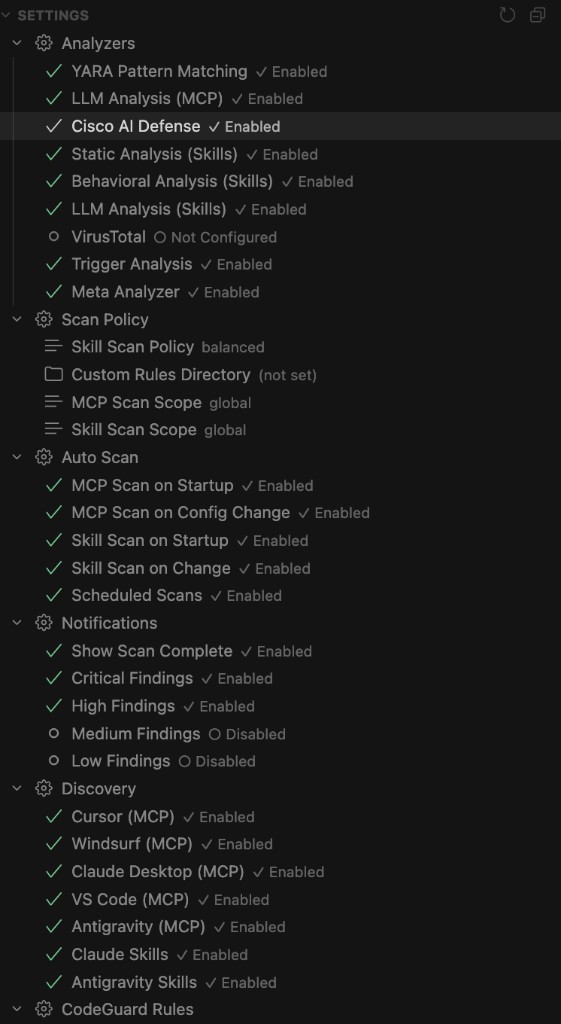
| Settings | Quick access to toggle analyzers, notifications, and scan scope without leaving the sidebar. |

Interacting with findings:
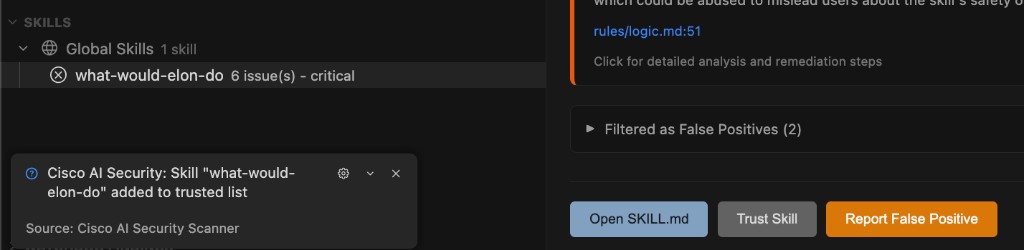
- Click a finding to open its detail panel with full description, recommendation, and metadata
- Right-click a finding for actions: Add to Allowlist, Remove Server, Report False Positive, Rescan
- Click a skill finding with a file path to jump directly to the relevant line in your editor
CodeLens and Inline Decorations
CodeLens — In MCP configuration files (JSON/JSONC), a clickable CodeLens annotation appears above each server definition. It shows the scan status and finding count for that server. Click it to run a targeted scan on that specific config.
Inline decorations — After a scan, status indicators appear directly in MCP config files next to server and tool entries:
- Green checkmark for safe items
- Yellow/red indicators for items with findings
Both CodeLens and inline decorations can be toggled via settings:
mcp-scanner.ui.codeLens(default: on)mcp-scanner.ui.inlineDecorations(default: on)
Skill file annotations — When a skill scan finds issues, the scanner adds:
- CodeLens above the relevant section in the skill file
- Inline decorations highlighting the specific lines
- Diagnostics entries in the Problems panel
Problems Panel and Quick Fixes
All findings from both MCP and skill scans are surfaced as diagnostics in VS Code's built-in Problems panel (Cmd/Ctrl+Shift+M). This means findings appear alongside your linter errors, type errors, and other diagnostics in a single unified view.
Each diagnostic includes:
- Severity mapped to VS Code's Error/Warning/Information levels
- Message with the finding title and threat type
- Location pointing to the relevant file and line
Quick fixes (the lightbulb icon) are available on each diagnostic:
- Add to Allowlist — Suppress this finding for the identified server, tool, or skill
- Remove Server — Remove the flagged server from the MCP config
- Report False Positive — Flag the finding for review
Status Bar
A persistent status bar item in the bottom-left corner shows the scanner's current state at a glance:
| State | Meaning |
|---|---|
| Initializing | Extension is loading, setting up Python environment |
| Ready | Idle and ready to scan |
| Scanning | A scan is currently in progress |
| Safe | Last scan completed with no findings |
| Issues Found | Last scan found one or more findings (shows count) |
| Error | Something went wrong — check the output panel |
| Setup Required | First run — open the Setup Wizard to configure |
Click the status bar item to run Scan All (MCP + Skills).
Report Export
Export scan results for sharing, compliance, or CI/CD integration. Run Export Scan Report from the Command Palette and choose a format:
| Format | Best for |
|---|---|
| JSON | Machine-readable output, CI/CD pipelines, programmatic analysis |
| Markdown | Human-readable reports, documentation, team sharing |
| CSV | Spreadsheet analysis, tracking over time, management reporting |
The report includes all findings from the most recent scan, with full details: severity, analyzer, threat type, description, and recommendation.
Scan Comparison
Compare the current scan with a previous one to track your security posture over time. Run Compare with Previous Scan from the Command Palette.
The comparison shows:
- New findings — Threats that appeared since the previous scan
- Resolved findings — Issues that are no longer present
- Unchanged findings — Persistent issues that still need attention
This is particularly useful after updating MCP server versions, modifying skills, or adding items to the allowlist.